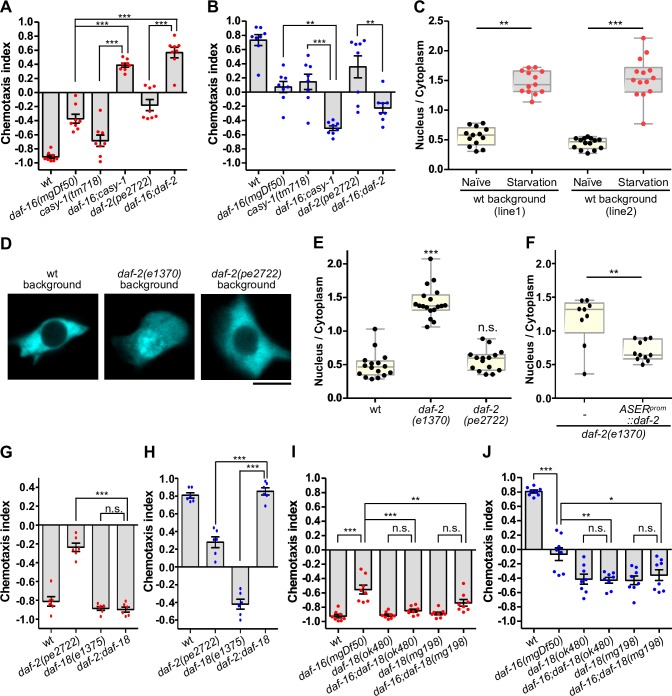
Fig 3. DAF-16 regulates taste avoidance learning in ASER independently of the DAF-2c pathway.
(A, B) Salt chemotaxis after conditioning under starvation with high (A) or low (B) salt (N = 8). A red or blue dot represents a chemotaxis index obtained from each trial after conditioning with high or low salt, respectively. (C) Quantitative analyses of DAF-16::GFP localization in ASER before (naïve) and after starvation conditioning on agar plates containing 100 mM of salt for an hour (N > 12 animals). Fluorescence intensity ratios of the nucleus to the cytoplasm are shown. Two lines of animals, JN2837 and JN2885, were examined. (D, E, F) Analyses of DAF-16::GFP localization in ASER after incubation on an agar plate with 50 mM of salt and food at 25°C for two hours (E; N > 8 animals). Scale bar indicates 5 μm. (C, E) Dunn's multiple test following Kruskal-Wallis test, **p < 0.01 and ***p < 0.001. (F) DAF-2(exon 11.5-) was expressed by the ASER-specific gcy-5 promoter. Mann Whitney test, **p < 0.01. (G-J) Salt chemotaxis after high- (G, I) or low-salt (H, J) conditioning in the absence of food. (A, B, G-J) Error bars indicate SEM. Tukey’s test following one-way ANOVA, n.s. p > 0.05, *p < 0.05, **p < 0.01, and ***p < 0.001.

