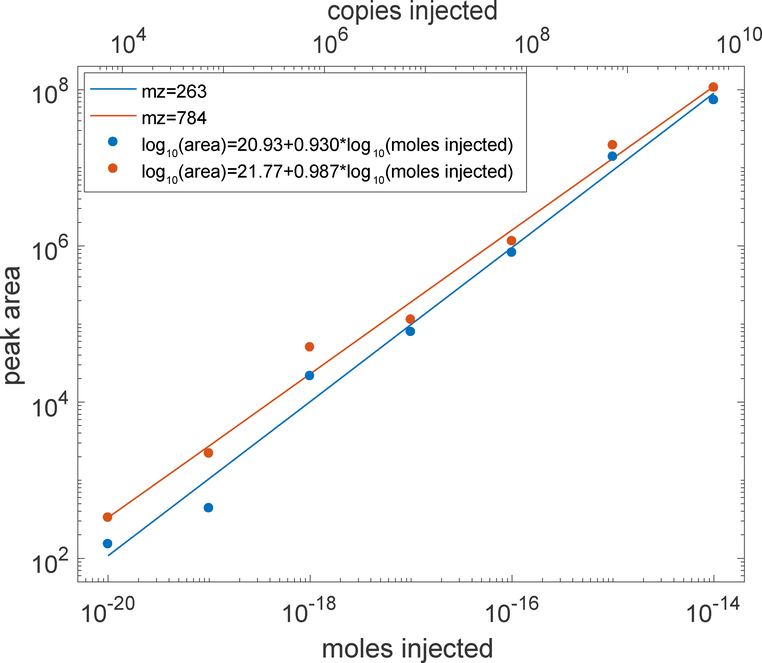
Figure 1 –
log-log calibration curve of PRM analysis of angiotensin. Moles injected are shown on the bottom X-axis, and copies of angiotensin injected are shown on the top axis. Peaks were fit with a Gaussian function; peak area is the product of the height and width of the fitted function. Several 10 zmol injections did not generate peaks for mz 784; a value of zero area was used in calculating that average.

