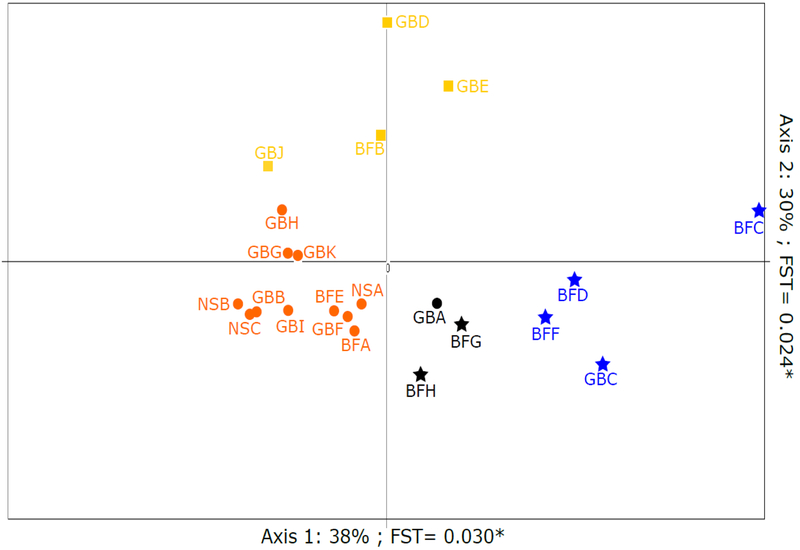
Figure 2:
Principal Component Analysis (PCA) of a covariance matrix from the genetic data of GoM. Both axes are significant: Axis 1: percent inertia=38%, FST =0.030, p=0.004; Axis 2: percent inertia=30%, FST =0.024, p=0.000. Shapes correspond to the genetic clusters suggested by the AMOVA analyses (Circles=Southern Cluster; Stars=Northern Cluster; Squares=Mixed Cluster).

