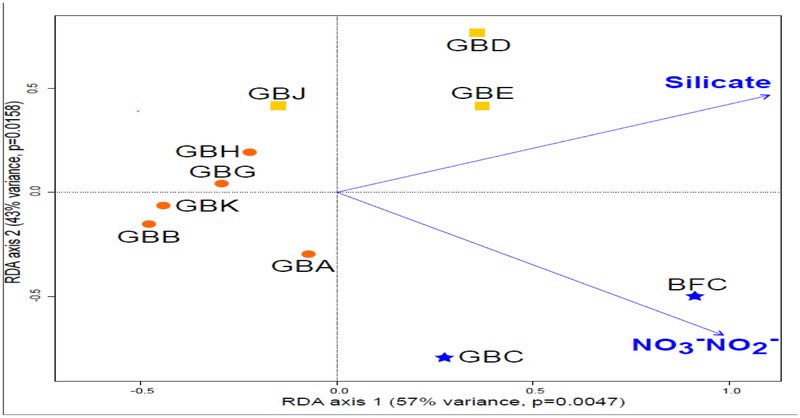
Figure 4:
Environmental association analysis based on distance-based Redundancy Analysis (dbRDA). RDA plot for significant environmental factors (silicate, P=0.0068; nitrate+nitrite, P=0.0007). Colors correspond to the clusters suggested by the STRUCTURE analyses (Orange=Southern Cluster; Blue=Northern Cluster; Yellow=Mixed Cluster).

