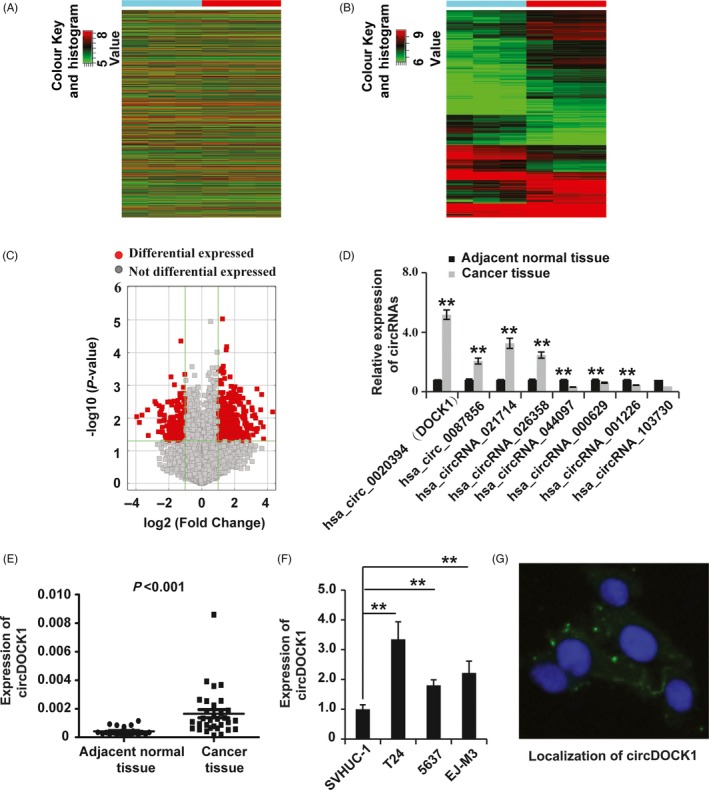
Figure 1.

Identification of differentially expressed circRNAs in BC. (A and B) Hierarchical clustering of the circRNA expression data shows distinguishable gene expression profiles among the BC and adjacent normal tissues. (C) Volcano plots for circRNAs differentially expressed between the two different tissue types. (D) qPCR analysis of circRNAs differentially expressed between the two different tissue types. GAPDH was used as the control. (E) qPCR analysis of circDOCK1 expression in BC (n = 23) and adjacent normal tissues (n = 32). GAPDH was used as the control. (F) qPCR analysis of circDOCK1 expression in immortalized human bladder epithelial SVHUC‐1 cells and the BC cell lines BIU‐87, EJ‐M3, T24 and 5673. (G) Localization of circDOCK1 detected by fluorescence in situ hybridization in EJ‐M3 cells. Cell nuclei were counterstained with Hoechst (blue). GAPDH was used as the control. Each experiment was repeated a minimum of three times. The symbol * denotes a significant difference (P < 0.05), while ** represents a highly significant difference (P < 0.01) in a two‐tailed Student's t test
