Figure 3.

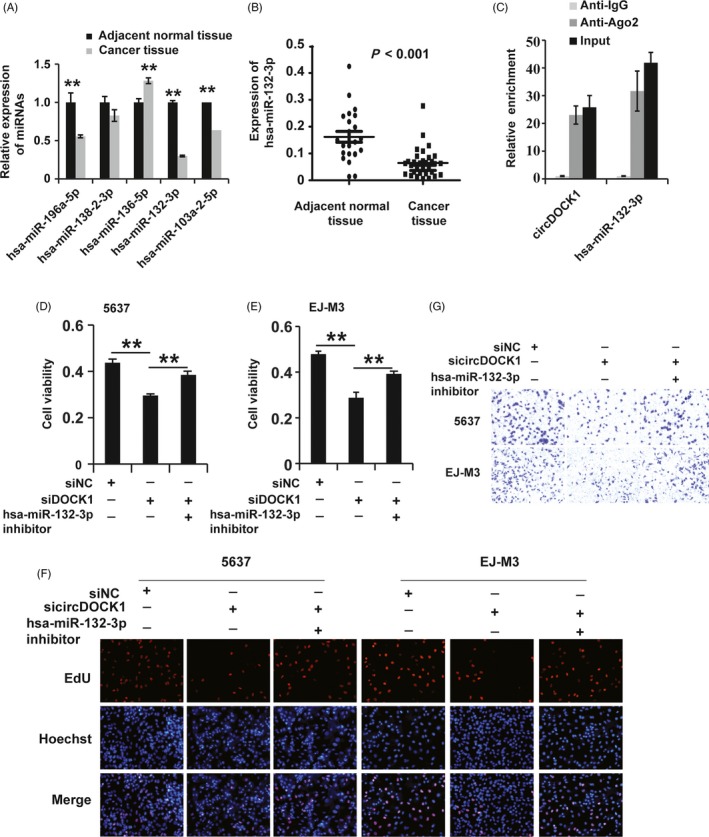
CircDOCK1 acted as a molecular sponge for hsa‐miR‐132‐3p. (A) qPCR analysis of the expression of candidate miRNA targets of circDOCK1 in BC and adjacent normal tissues. U6 was used as the control. (B) qPCR analysis of the expression of the candidate hsa‐miR‐132‐3p in BC (n = 23) and adjacent normal tissues (n = 32). U6 was used as the control. (C) The correlation between circDOCK1 and Ago2 was detected by a radioimmunoprecipitation (RIP) assay. Cell lysates were immunoprecipitated using an anti‐Ago2 antibody or IgG. The expression of circDOCK1 and hsa‐miR‐132‐3p was investigated by qRT‐PCR. (D and E) CCK8 assay for the viability of 5637 and EJ‐M3 cells transfected with the sicircDOCK1, sicircDOCK1 + miR‐132 inhibitor and control siRNAs (siNC). (F) EdU assay for the proliferation of 5637 and EJ‐M3 cells transfected with the sicircDOCK1, sicircDOCK1 + miR‐132 inhibitor and control siRNAs (siNC). (G) Transwell assay for the migration potential of 5637 and EJ‐M3 cells transfected with the sicircDOCK1, sicircDOCK1 + miR‐132 inhibitor and control siRNAs (siNC). Each experiment was repeated a minimum of three times. The symbol * denotes a significant difference (P < 0.05), while ** represents a highly significant difference (P < 0.01) in a two‐tailed Student's t test
