
Figure 1.
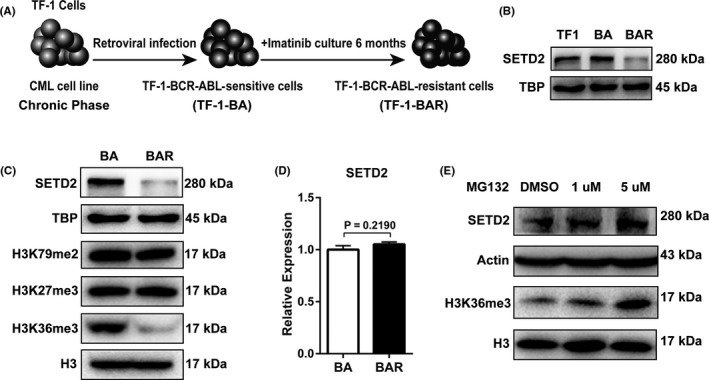
SETD2 is downregulated in imatinib (IM)‐resistant cells compared with IM‐sensitive cells. A, Establishment of the IM‐sensitive and IM‐resistant cells. TF1 cells were sensitized to IM after infection with the p210BCR‐ABL retrovirus (TF1‐BA). Following 6 mo of continuous IM treatment, the cells became resistant to IM (TF1‐BAR). B, Western blot analysis of SETD2 expression level among TF1, TF1‐BA and TF1‐BAR cells. C, Western blot assays were performed to compare the protein expression levels of SETD2, H3K36me3 and associated histone‐modified sites between the TF1‐BA and TF1‐BAR cells. D, The SETD2 expression level in the TF1‐BA and TF1‐BAR cells was quantified by qRT‐PCR analysis and normalized to the β‐actin expression level. E, Western blot analysis of SETD2 and H3K36me3 expression changes due to MG132 treatment. Data are presented as the mean ± SD of three independent experiments. Data were analysed using the unpaired Student's t test