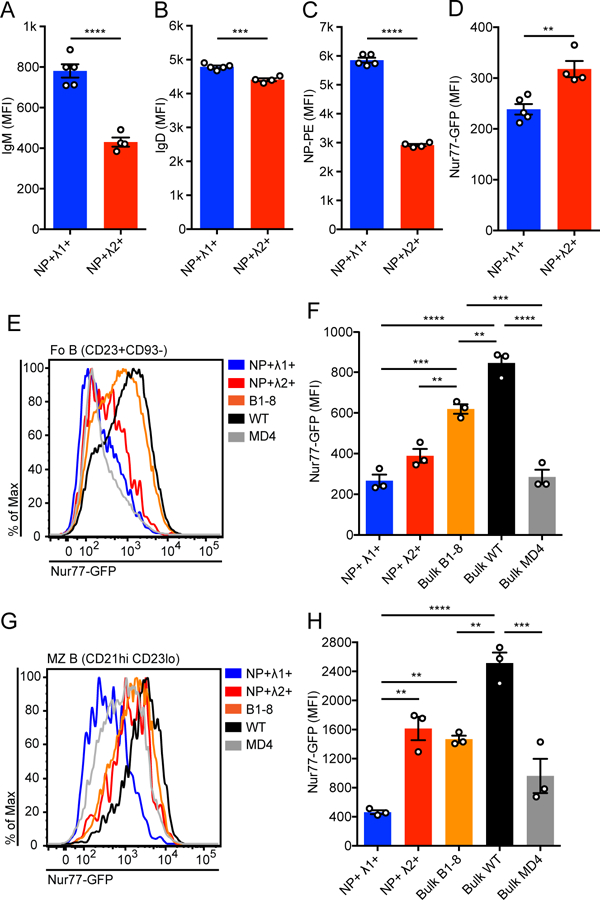
Figure 2. Igλ1+ and Igλ2+ NP-binding B cell populations exhibit different cross-reactivity to endogenous antigens.

(A-D) NP+ Igλ1+ and NP+ Igλ2+ LN B cells were analyzed for surface IgM expression (A), surface IgD expression (B), NP binding (C), and Nur77-eGFP expression (D). Values in A-D were obtained from n = 4–5 mice, and p-values for A-D pairwise comparisons were calculated using Welch’s t test.
(E-H) Representative histograms and MFI ± SEM of Nur77-eGFP expression in splenic follicular (Fo) mature (E, F) or marginal zone (MZ) (G, H) B cells from B1–8i, WT, and MD4 mice. Values were obtained from n = 3 mice of each genotype. (Fo mature = CD23+CD93−, MZ = CD21hi CD23lo). One-way ANOVA with Tukey’s multiple comparisons test was used to calculate p-values in F, H.
**p<0.01, ***p<0.001, ****p< 0.0001.
