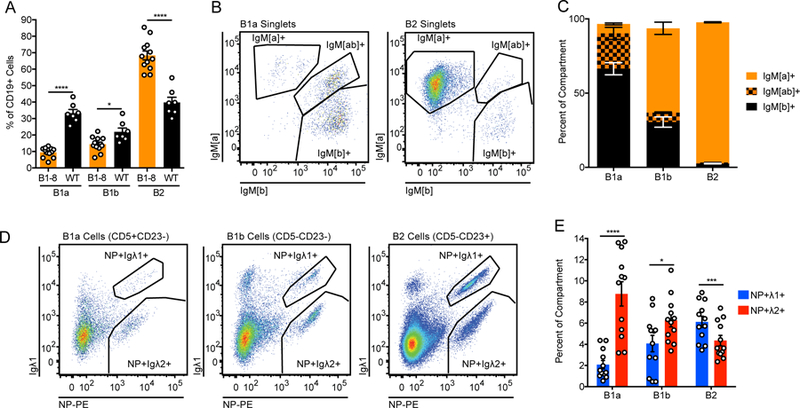
Figure 3. Development of B1–8i NP+ Igλ1+ B1a cells is highly disfavored.

(A) Peritoneal compartment sizes in B1–8i and WT mice. Values were obtained from n = 12 B1–8i and n = 7 WT mice. Welch’s t test was used to calculate p-values. (B1a = CD19+CD5+CD23−, B1b = CD19+CD5-CD23−, B2 = CD19+CD5-CD23+; see gating in Supplemental Fig. 1D).
(B, C) Representative gating and quantification of heavy chain usage in B1–8i peritoneal B cell subsets. A concatenated sample from n = 4 mice is displayed for clarity, and gating is representative of n = 7 mice. The knocked-in B1–8i heavy chain is allotype [a], and the endogenous heavy chain is allotype [b].
(D, E) Representative gating and quantification of light chain usage in NP-binding peritoneal populations from B1–8i mice. A concatenated sample from n = 3 mice is displayed for clarity, and gating is representative of n = 12 mice. Values were obtained from n = 12 mice, and a ratio paired t test was used to calculate p values.
*p<0.05, ***p<0.001, ****p< 0.0001.
