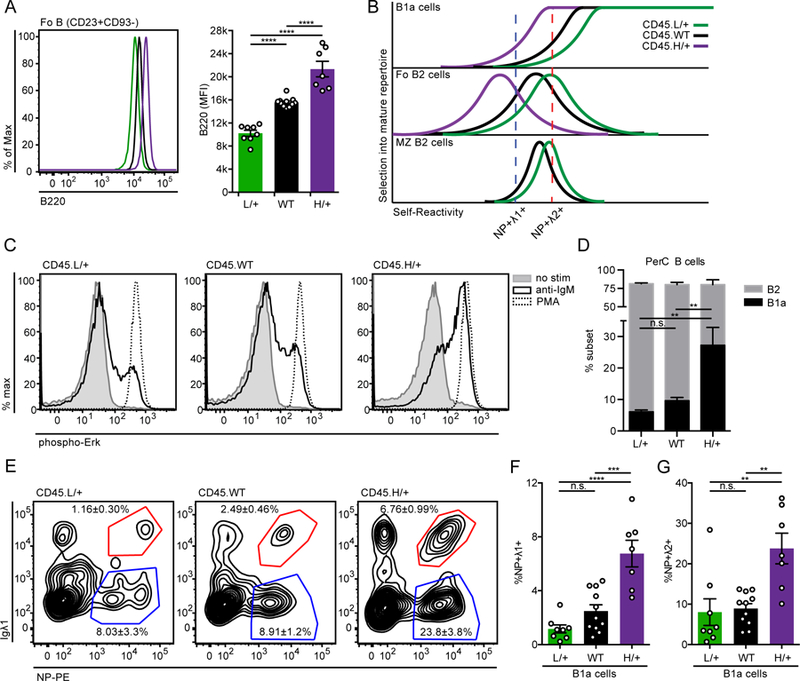
Figure 6. Enhancing BCR signal strength via genetic titration of CD45 surface expression promotes development of NP-binding B1a cells.

(A) Representative histogram (left) and quantification (right) of B220 expression on Fo B cells (CD23+CD93−) from CD45.L/+, CD45.WT, and CD45.H/+ mice with the B1–8i transgene. Statistics were calculated from n = 7–11 mice of each genotype.
(B) Model depicts efficiency (y-axis) of selecting individual BCRs of varying self-reactivity (x-axis) into the mature repertoire of B1a, Fo, and MZ compartments. Colored graphs depict predicted shifts in the degree of self-reactivity selected into these compartments with altered strength of BCR signal transduction conferred by CD45 titration. L/+ (green) curve shows effect of reducing CD45 expression and signal strength, while H/+ (purple) curve shows effect of increasing CD45 expression and signal strength. With increased signal strength, mature B cell repertoires are rendered less self-reactive because excess signaling compensates for impaired antigen recognition in vivo. The opposite is true for reduced signal strength. Relative self-reactivity of NP-binding Igλ1+ (blue) and Igλ2+ (red) cells is plotted to show how altering signal transduction would be predicted to alter selection of these BCRs into mature B cell compartments.
(C) LN cells were stimulated for 3 minutes with media alone, 10ug/ml anti-IgM, or PMA, then fixed, permeabilized, and stained to detect intra-cellular pErk and the B cell marker CD23. Histograms depict CD23+ B cells and data are representative of at least 3 independent experiments.
(D) PerC cells from CD45.L/+, CD45.WT, and CD45.H/+ mice with the B1–8i transgene were stained to detect B cell subsets as gated in Supplemental Fig 1D. Graph depicts % B1a and B2 PerC cells ± SEM in each genotype.
(E-G) Representative gating (E) and quantification of (F) NP+ Igλ1+ and (G) NP+ Igλ2+ B1a cells (CD5+CD23−) isolated from PerC of mice described in (D). In (E), concatenated samples from n = 7–11 mice is displayed for gating, and statistics were calculated using each mouse individually. Mean ± SEM is displayed associated with each subset. WT data in (E-G) contains values from Figure 3E for reference.
One-way ANOVA with Tukey’s multiple comparisons test was used to calculate p-values when analyzing a phenotype (e.g. %NP+ Igλ1+ or B220 MFI) across the full allelic series (A, D, F, and G).
**p<0.01, ***p<0.001, ****p< 0.0001.
