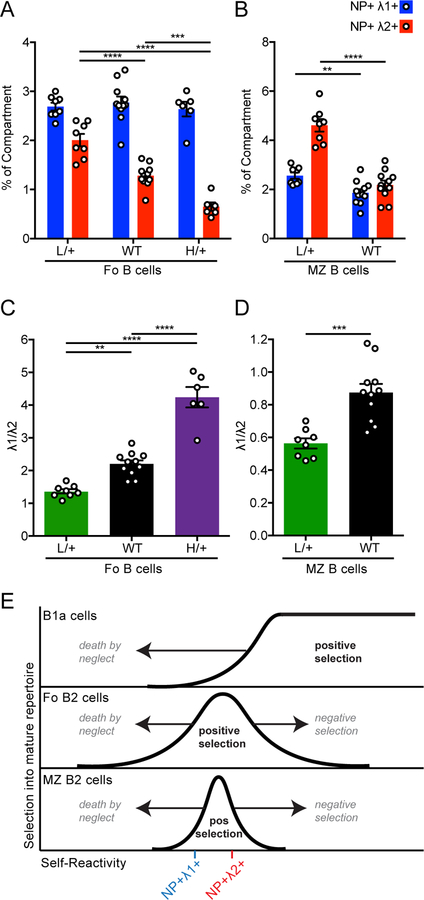
Figure 7. Enhancing BCR signal strength promotes negative selection of NP+ Igλ2+ but not NP+ Igλ1+ cells.
(A-B) Quantification of splenic NP+ Igλ1+ and NP+ Igλ2+ Fo (A) and MZ (CD21hi CD23lo) (B) B cells in mice described in Fig 6. Statistics were calculated from n = 7–11 mice of each genotype.
(C-D) The ratio of Igλ1+ to Igλ2+ cells within the NP+ population was calculated for Fo (C) and MZ (D) populations in mice described above. Statistics were calculated from n = 7–11 mice of each genotype.
(E) Model (analogous to that depicted in Figure 6B) depicts efficiency (y-axis) of selecting individual BCRs of varying self-reactivity (x-axis) into the mature repertoire of B1a, Fo, and MZ compartments. Area to the left of the curve corresponds to BCRs that are counter-selected into a given mature compartment because of insufficient endogenous antigen recognition (failed positive selection or “death by neglect”), while to the right of the curve lie BCRs that are counter-selected because of excess self-reactivity (negative selection). The graphs also depict efficiency of selection of Igλ1+ and Igλ2+ NP-binding populations into mature B cell compartments.
One-way ANOVA with Tukey’s multiple comparisons test was used to calculate p-values when analyzing a phenotype across the full allelic series (A, C). Welch’s t test was used to calculate p-values in (B) and (D). Non-significant findings are omitted for clarity.
**p<0.01, ***p<0.001, ****p< 0.0001.

