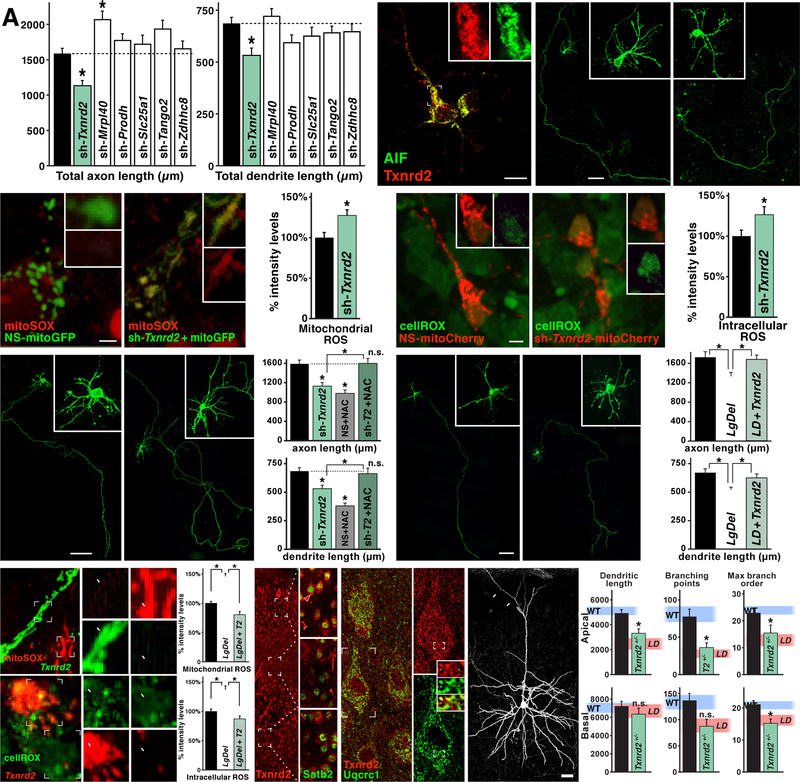
Figure 6:
Txnrd2 regulates ROS levels, axonal and dendritic growth in layer 2/3 PNivt. A) shRNA-mediated diminished expression (knock-down) of six mitochondrial localized 22q11 genes (Maynard et al., 2008) in LgDel in WT layer 2/3 PNivt. Knock-down of only one gene, Txnrd2, recapitulates LgDel axon and dendrite growth deficits (*p<0.0084), and does so at similar magnitudes seen in LgDel. The mitochondrial ribosomal protein Mrpl40, when depleted, results in a significant increase of axon, but not dendrite length in WT layer 2/3 PNs (*p<0.0049). B) Txnrd2 protein (red) is expressed in a pattern consistent with mitochondrial localization in layer 2/3 PNivt based upon substantial co-localization with the mitochondrial marker Apoptosis Inhibitory Factor (AIF; green) in the cell body and initial segment of neurites. Inset single channel, higher magnification images of Txnrd2 (red) and AIF (green) showing punctate, presumed mitochondrial labeling from a proximal neurite of the layer 2/3 PNivt shown at low power in (B). C) Differences in axon and dendrite growth in non-sense shRNA control (NS-shRNA) and sh-Txnrd2 electroporated layer 2/3 PNs. D) Enhanced mitoSox labeling of mitochondrial ROS in sh-Txnrd2 electroporated WT layer 2/3 PNs (*p,0.0058). E) Enhanced cellROX labeling of cytosolic ROS in sh-Txnrd2 electroporated WT layer 2/3 PNs (*p,0.042). F) NAC-mediated rescue of diminished axon and dendrite growth of sh-Txnrd2 electroporated WT layer 2/3 PNs. NAC restores sh-Txnrd2 layer 2/3 PN axon and dendrite lengths to WT levels, dotted lines, no significant difference (ns). As for non-electroporated WT layer 2/3 PNs, NAC treatment decreases NS-shRNA axon and dendrite growth. G) Txnrd2 re-expression restores LgDel layer 2/3 PN axon and dendrite growth. H, I) Txnrd2 re-expression restores mitochondrial and cytosolic ROS to WT levels in LgDel layer 2/3 PNivt. Insets adjacent to (H) Txnrd2-electroporated cells (t; green) have low levels of mitoSOX (red); untransfected cells (u, not green) have high levels of ROS (red). Insets adjacent to (I): Txnrd2-electroporated cells (t; red) have low levels of cellROX (green); untransfected cells (u, not red) have high levels of ROS (green). At right of (H) and (I) quantification confirms restoration of mitochondrial and intracellular ROS by Txnrd2 re-expression (* p<0.0001). J) Txnrd2 protein (red) in cortical PNs is enhanced in layer 2/3 PNs. The insets, imaged at identical gain, show at higher magnification enhanced Txnrd2 (cytoplasmic labeling; red) in Satb2 expressing (nuclear labeling; green) layer 2/3 (arrowhead) versus 5/6 PNs. K) In P21 layer 2/3 PNs, Txnrd2 protein (punctate cytoplasmic labeling; red) co-localizes with Uqcrc1 (green), a mitochondrial marker. At right, higher magnification images of a single layer 2/3 PN shows Txnrd2 (red; top) labeling of a single layer 2/3 PN as well as the coincident Uqcrc1 labeling in the same neuron (green, bottom). Insets Punctate, presumed mitochondrial, labeling for Txnrd2 (red, top) and Uqcr1 (green, bottom). In the middle panel, arrows indicate punctate co-localization of Txnrd2 and Uqcrc1 in presumed individual mitochondria. L) Apical dendrite length and dendritic branching is significantly decreased in sparsely recombined, eYFP, individual Txnrd2+/− layer 2/3 PNs in vivo, in an otherwise P21 WT mouse compared to WT controls. Apical dendrite retraction is not seen (arrows). Quantification confirms that this decline (apical dendrite length *p<0.0077; apical branch points *p<0.0007; apical max branch order *p<0.0225; basal max branch order *p<0.02) is similar to that in LgDel layer 2/3 PNs in vivo. Pink, shaded horizontal bands on each histogram indicate mean LgDel (LD) values (see Figure 4D) ± S.E.M.
All histogram data represent mean values + SEM. Scale bar 10 μm for 6B. 50 μm for 6C, F, and G. 2.5 μm for 6D, and E. 25 μm for 6L.

