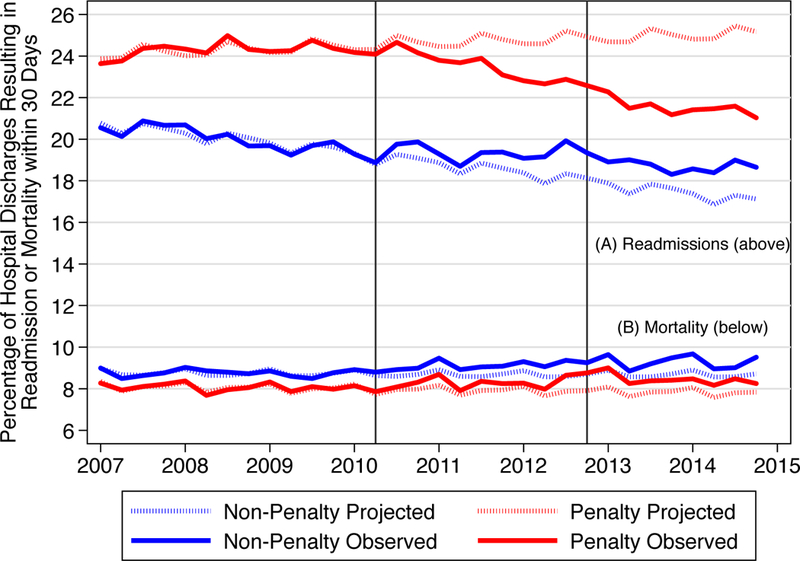
Figure 1. Observed and Projected Rates by Hospital Penalty Status.

A Readmissions
B Mortality
Figure 1 plots observed risk-adjusted HF readmission rates (Panel A) and mortality rates (Panel B) by quarter-year as well as projected rates that were estimated using regression models to represent trends in the absence of the HRRP. Rates are displayed separately for penalty and non-penalty hospitals. Results show divergent readmission trends by penalty status, with decreased readmissions at penalized hospitals and increased readmissions at non-penalized hospitals. In contrast, mortality trends were similar at penalized and non-penalized hospitals. These findings suggest that factors other than the HRRP may have contributed to rising mortality during this period, particularly at non-penalized hospitals.
