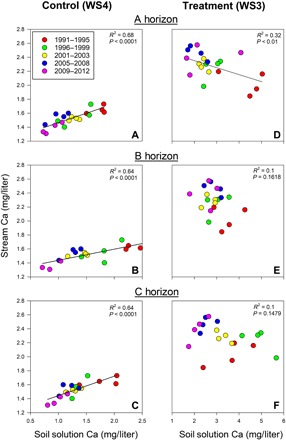
Fig. 2. Vegetation-mediated soil cation changes.

Mean annual stream water calcium concentration related to mean annual soil solution calcium concentration for A (A and D), B (B and E), and C (C and F) soil horizons in both the control (WS4) and treatment (WS3) watersheds during the treatment period (1991–2012). Relationships were considered significant if P < 0.05. The year 2004 was excluded as described in the Methods section.
