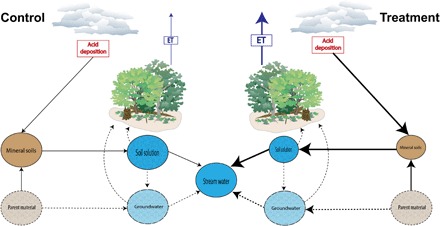
Fig. 5. Conceptual diagram of the impact of acid deposition on calcium cycling and subsequent plant water use.

Relative differences in calcium pools and fluxes as well as relative magnitudes of acid deposition and ET between the control (left) and treatment (right) watersheds. Pools are shown as circles and fluxes as arrows. Size of pools and fluxes are relative but not to scale. Pools or fluxes where measurements were not made are shown with dashed lines. Processes and some pool sizes (e.g., mineral soils) are derived from (32).
