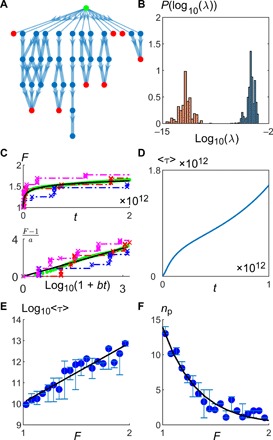
Fig. 3. Logarithmic fitness trajectory emerges from hopping between MSs.

(A) The average fitness trajectory from an initial MS (green circle) was found by constructing a Markov chain that includes all possible beneficial single mutants that a non-MS (blue circles) can go to and all possible beneficial double mutants that an MS (red circles) can go to. Here, we show a subset of the whole tree, with the thickness of the arrows proportional to −1/ log(λ), where λ is the transition rate. (B) The transition rates out of an MS (red histogram) are typically much slower than those out of a non-MS (blue histogram). (C) Average fitness trajectory increases logarithmically with time. The green points are data obtained from analyzing the Markov chain, while the black line is the fit to the logarithmic function F = 1 + a log(1 + bt). The red, blue, and purple dotted lines are examples of individual trajectories, with the crosses corresponding to fixation events. (D) Average trapping time 〈τ〉 scales approximately linearly with time, showing that as the population evolves, it enters MSs that are harder and harder to get out off. (E) The average τ (blue circles) of an MS seems to increase exponentially with its fitness. The black line is a fit to a straight line. (F) The average number of escape paths from an MS np seems to decrease exponentially with its fitness. The black line is a fit to the exponential function. In both (E) and (F), the averages are taken over states in a single Markov chain, with the weight of each state proportional to the probability of encountering that state, and the error bars represent 95% confidence intervals (parameters: L = 200, μ = 10−8, β = 0.9, Δ = 0.05, ρ = 0.05).
