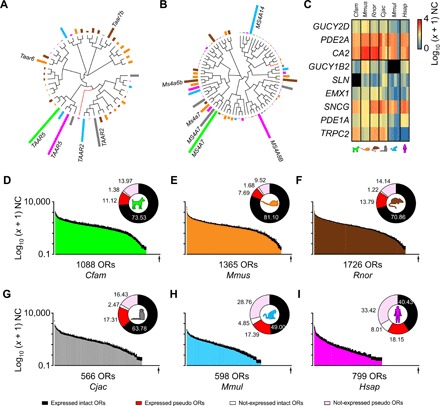
Fig. 2. Gene expression profiles of nasal chemosensory receptors in mammals.

(A and B) Unrooted phylogenetic tree and mean expression levels for all TAAR (A) and MS4A (B) receptor orthologs in the six species. Bars indicate the mean contribution (%) of each receptor to the total gene expression within each family and per species. Red branches indicate pseudo and truncated OR genes. Black branches indicate intact OR genes. (C) Heatmap of the expression pattern for markers of Gucy2D+ (GC-D+) and Gucy1b2+ OSNs in mammals. RNA expression levels are represented on a log10 (x + 1) scale of normalized counts (0, not expressed; 4, highly expressed). Black squares indicate, for a given species, genes where no orthologs were found annotated in the genome version analyzed. TRPC2 is a pseudogene in human and macaque, and GUCY1B2 is a pseudogene in human. (D to I) Distribution of mean expression values for each of the OR genes in the WOM of dog (D), mouse (E), rat (F), marmoset (G), macaque (H), and human (I). Genes are displayed in descending order of their mean expression values [log10 (x + 1) normalized counts]. Error bars represent the SEM from three to four individuals. Insets: circular plots show the percentages of intact and pseudo plus truncated ORs expressed (≥ 1 normalized counts) or not expressed (< 1 normalized counts) in at least one individual. Under the x axis, the total number of ORs within each species and the position of the last OR plotted (arrow) are noted.
