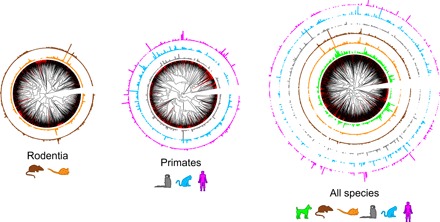
Fig. 3. Abundance for all OR-expressing OSN subtypes across mammalian evolution.

Unrooted phylogenetic trees containing the mean expression levels for all OR genes from the orders Rodentia and Primates separately and for all six species. Bars indicate the mean contribution (%) of each receptor to the total gene expression within each receptor family and per species. Red branches indicate pseudo and truncated OR genes. Black branches indicate intact OR genes.
