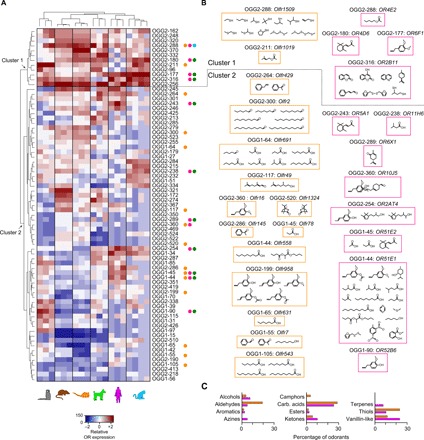
Fig. 4. Ligand biases for highly conserved OR-expressing OSN subtypes across mammalian evolution.

(A) Heatmap of the expression pattern for the ORs populating the highly conserved 73 OGGs across all species. Two clusters were identified (arrows): cluster 1 containing highly abundant ORs across all species and cluster 2 containing highly abundant ORs only in one or a subset of species. Normalized percentage values of expression are represented on a relative abundance scale (−2, lowly abundant; +2, highly abundant). OGGs containing human and/or mouse deorphaned ORs are indicated by orange and fuchsia circles, respectively. Mouse ORs activated by SMCs and human ORs activated by KFOs are indicated by cyan or dark green circles, respectively. Class I and class II ORs are indicated by the OGG1- and OGG2- prefixes, respectively. (B) Odorants recognized by the deorphaned mouse (left column and within orange rectangles) and human (right column and within fuchsia rectangles) ORs. In some, but not all cases, ligands for the same OR have similar structures. In one of three OGGs (OGG2-288) containing both deorphaned mouse and human ORs, the ligands are different in structure and perceived odors. (C) Percentage of odorants, according to their chemical class, activating mouse and/or human ORs.
