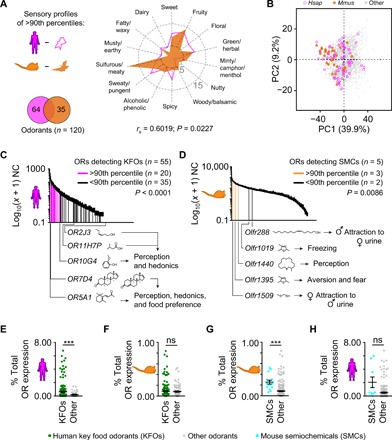
Fig. 5. Sensory profile and detection of ecologically relevant odorants by highly abundant ORs/OSN subtypes in mouse and humans.

(A) The sensory profiles (spider plot) of the odorants detected exclusively by either mouse or human ORs above the 90th percentile of expression (Venn diagram) are vastly overlapping and significantly positively correlated (rs = 0.6019, P = 0.0227). (B) PCA of the 696 physicochemical descriptors of odorants detected exclusively by either mouse or human ORs above the 90th percentile of expression [see bottom left in (A)]. Percentages of the variance explained by the PCs are indicated in parentheses. The mouse- and human-specific odorants greatly overlap in the odor space. (C and D) Distribution of mean normalized counts represented on a log10 (x + 1) scale expression values for each of the OR genes in the human (C) and mouse (D) WOM. OR genes detecting at least one human KFO or a mouse SMC are indicated according to their expression percentile (fuchsia/orange, above the 90th percentile; black, below the 90th percentile). Known OR-ligand pairs playing a role in olfactory perception, hedonics, or behavior are indicated below the x axis. Error bars represent SEM from three sample replicates. Binomial test using Wilson-Brown method to calculate the confidence interval, two-tail. (E and F) The mean expression levels of ORs detecting human KFOs are 2.4 times higher in humans (E) but not in mouse (F). Unpaired t test with Welch’s correction, two-tail, ***P ≤ 0.001; ns, not significant (P ≥ 0.05). (G and H) The mean expression levels of ORs detecting mouse SMCs are 2.7 times higher in mouse (G) but not in humans (H). Unpaired t test with Welch’s correction, two-tail, ***P ≤ 0.01; ns, P ≥ 0.05.
