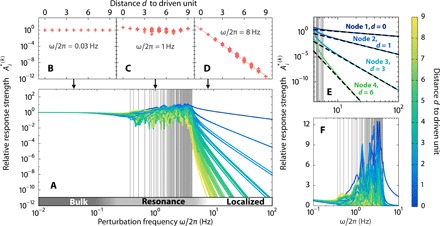
Fig. 2. Emergence of resonances and prediction of distinct network responses.

(A) The relative response strength of each unit in the fluctuation-driven network illustrated in Fig. 1A versus the signal frequency ω, color coded by the graph-theoretic distance d from the driven to the responding unit. The eigenfrequencies are indicated by gray vertical lines, and the three regimes of homogeneous bulk responses, heterogeneous resonant responses, and localized responses by the gray-level gradient bar at the bottom. (B to D) The relative response strengths characteristically depend on graph-theoretic distance, shown for individual frequencies representative for each of the three regimes. (E) In the localized regime, the response amplitudes for units 1 to 4 (marked in Fig. 1A) are well approximated by the analytic prediction (dashed lines) (Eq. 8). (F) Relative response strengths (plotted on linear scale) at resonance peaks may be an order of magnitude (here up to 12 times) larger than in the static response limit of ω → 0.
