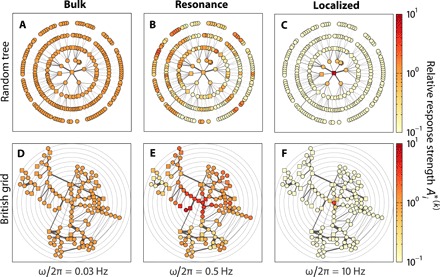
Fig. 3. Generality of response patterns.

For two exemplary networks, the response patterns for three signals of frequencies representing the three response regimes are indicated by their relative response strengths (color coded). Response patterns for (A) to (C), a random tree with N = 264, and (D) to (F), the topology of the British high-voltage transmission grid with N = 120, both reordered according to graph-theoretic distance from site of driving unit. For both networks, the driven unit is placed at the center with all units displayed on circles with their radii proportional to topological distance (gray concentric rings) in (D) to (F).
