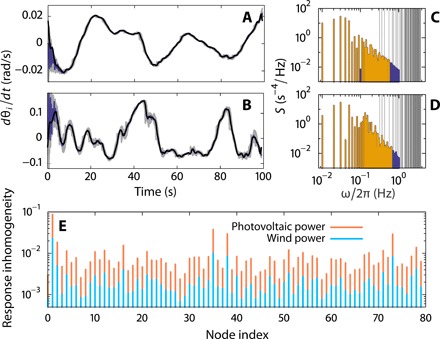
Fig. 5. Frequency resonances in power grids induced by wind and photovoltaic power fluctuations.

(A and B) Response time series of grid frequency in the network (Fig. 1A) for fluctuating power input signals (A) from wind and (B) from photovoltaic panels, with (C) and (D) as the respective power spectral density S(ω). One response time series is highlighted in purple (analytic prediction in black) and of all other units in gray. The prediction is based on 50 dominant Fourier modes of the signal, highlighted in yellow in (C) and (D). The gray vertical lines indicate the system’s eigenfrequencies. (E) The photovoltaic power fluctuations with stronger higher-frequency components induce greater nodal response inhomogeneity (for definition, see Materials and Methods) than the wind power fluctuations.
