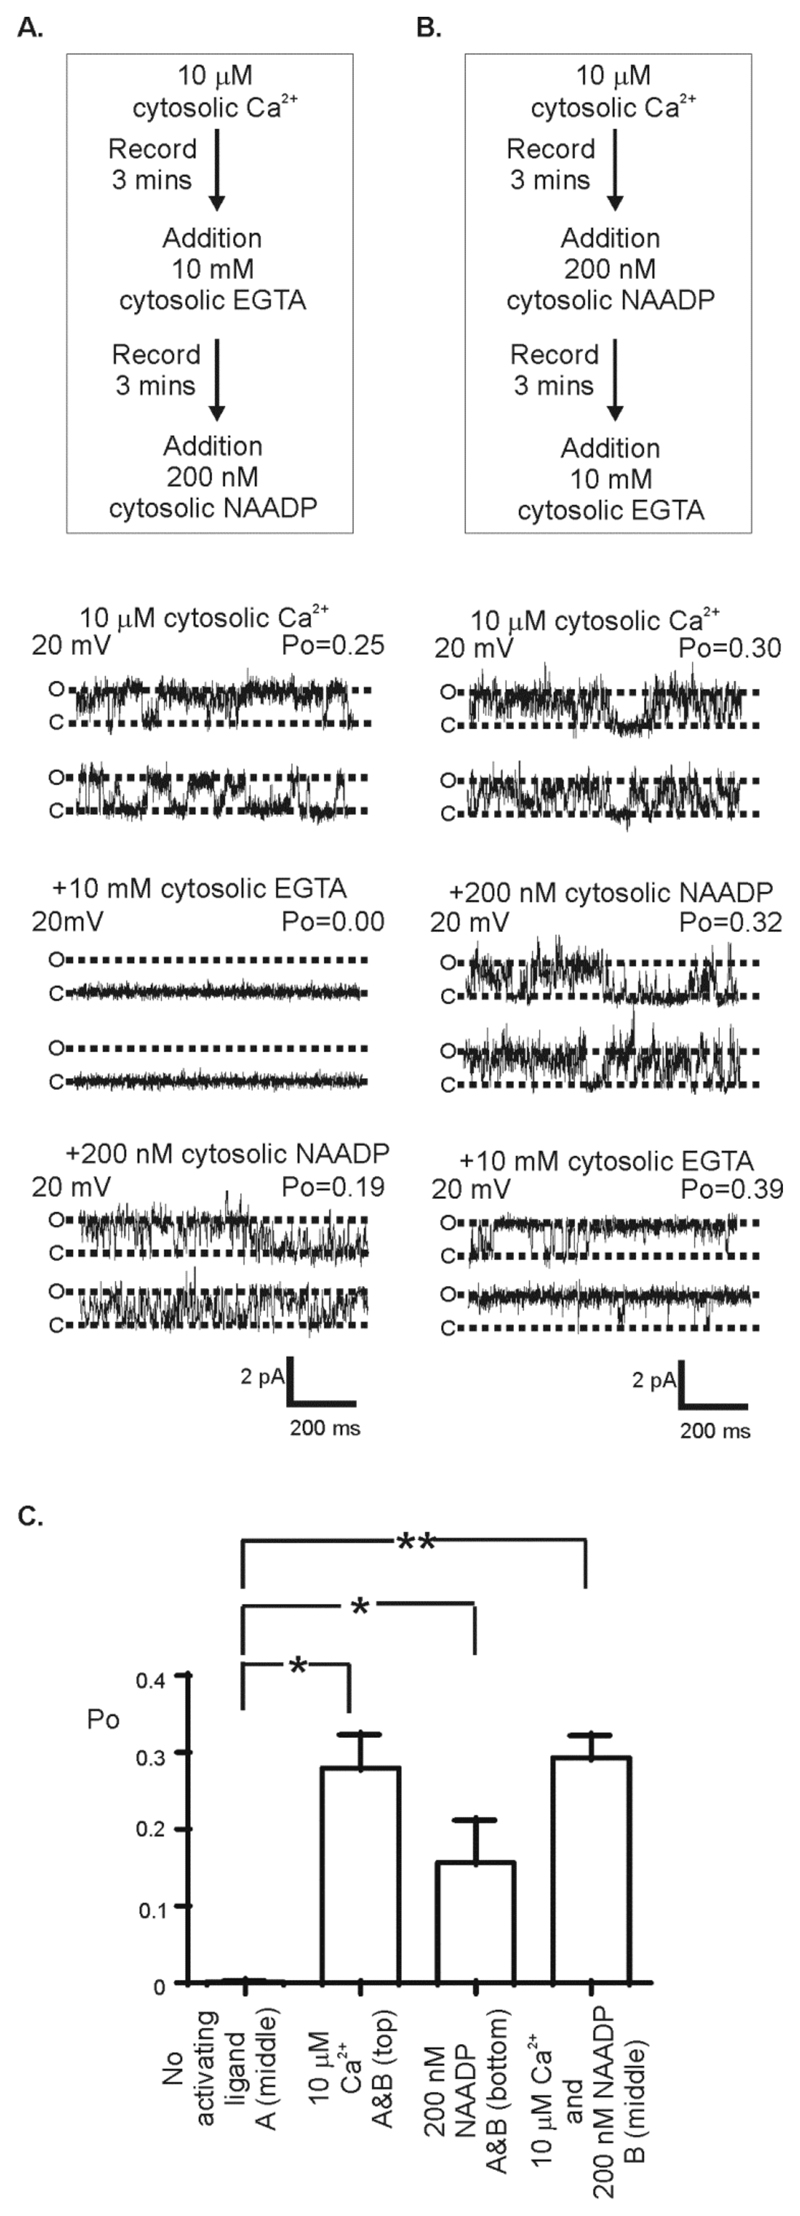
Figure 2. Effect of NAADP and cytosolic Ca2+ on TPC1 gating.
(A) Flow diagram detailing the experimental protocol with representative single-channel recordings shown below. TPC1 currents were recorded using K+ as permeant ion (symmetrical 210 mM KCl solution) (top), following the addition of 10 mM EGTA (cytosolic chamber) to lower cytosolic [Ca2+] to < 1 nM (middle), and after subsequent addition of 200 nM NAADP (cytosolic chamber) (bottom). (B) Flow diagram detailing the experimental protocol with representative single-channel recordings shown below. Current fluctuations show TPC1 activity with K+ as permeant ion (symmetrical 210 mM KCl solution) (top), after subsequent addition of 200 nM NAADP (cytosolic chamber) in the continued presence of 10 μM cytosolic Ca2+ (middle trace), and after subsequent addition of 10 mM EGTA (cytosolic chamber) to lower cytosolic [Ca2+] to < 1 nM (bottom). The dotted lines indicate the (O) open and (C) closed state of the channel. (C) The mean Po from 6 individual single-channel experiments. Below each bar, reference to each treatment (as shown in A and B) is provided. In the absence of activating concentrations of Ca2+ and NAADP in the cytosolic chamber (no activating ligand) single channel activity is undetectable and Po=0. ANOVA followed by a modified t-test was used to assess the difference between treatments *=p<0.05, **=p<0.01). Values are mean ± SEM.

