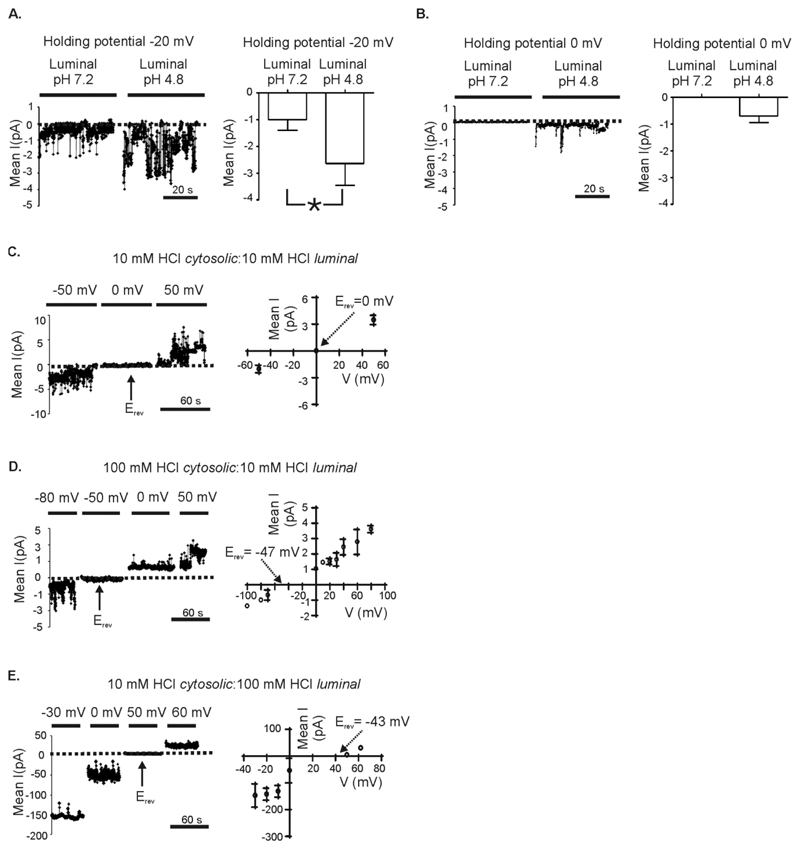
Figure 4. Effect of luminal pH on TPC1 gating.
Many channels were incorporated into the bilayer and the mean current was measured under the specified condition. Noise analysis of current fluctuations at -20 mV (A) and 0 mV (B) are shown using symmetrical 210 mM K+-acetate solutions. In (A) and (B) the pH of the solution in the cytosolic chamber was maintained at 7.2 and the pH of the solution in the luminal chamber is as indicated. The dotted line in each current trace shows the zero current level. The corresponding bar charts show the mean current from 4 paired experiments. Values are means ± SEM. A paired t-test was used to compare means (* = p < 0.05). (C-E) Noise analysis of current fluctuations at the indicated holding potential: (C) symmetrical pH 2, (D) pH 2 cytosolic chamber: pH 1 luminal chamber and (E) pH 1 cytosolic chamber: pH 2 luminal chamber. The current-voltage relationships to the right of the example traces show the mean data ± SEM obtained from 3-5 independent single-channel experiments. The arrows indicate the position of the reversal potentials.

