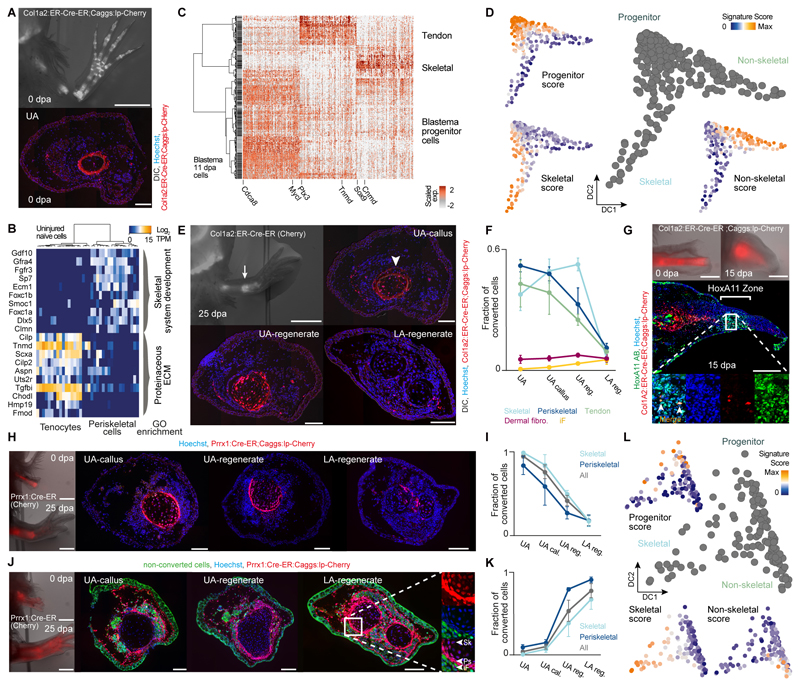
Fig. 4. Tracking different connective tissue subpopulations in the blastema reveals distinct cell sources for proximal versus distal limb regenerate tissue.
(A) Top: Fluorescence overlaid with bright-field image of Col1a2:ER-Cre-ER;Caggs:lp-Cherry (conversion at 3 cm size) limbs at 0 dpa overlaid with DIC. Bottom: Upper arm limb cross-section reveals labeling of periskeletal and tendon cells. Hoechst (blue), Col1a2:ER-Cre-ER;Caggs:lp-Cherry (red). (B) Heatmap showing distinct expression profiles for 36 mature limb periskeletal and tendon cells (Col1a2:ER-Cre-ER;Caggs:lp-Cherry labeled) with cells (columns) being hierarchically clustered (Pearson). GO enrichments are shown. (C) Cellular heterogeneity of labeled Col1a2:ER-Cre-ER;Caggs:lp-Cherry descendants in the 11 dpa blastema (349 cells). Heatmap visualizing expression of genes (columns) identified by PCA in 11 dpa blastema cells (rows, hierarchically clustered based on Pearson’s correlation). Transcript levels are scaled across columns. (D) Pseudotemporal trajectory obtained by Diffusion Map projection (26) on genes identified by PCA (Table S10) for 11 dpa blastema cells deriving from labeled Col1a2:ER-Cre-ER;Caggs:lp-Cherry descendants. Blastema progenitors are linked to 2 emerging cell lineages: non-skeletal (likely precursors to periskeletal cells and tenocytes) and skeletal. (23) Scores for developmental, non-skeletal and skeletal signatures projected onto the Diffusion Map are shown. (E) Top left: Fluorescence overlaid with bright-field image of Col1a2:ER-Cre-ER;Caggs:lp-Cherry limbs at 25 dpa. Scale bar: 2 mm. From top right to bottom left to bottom right: Limb cross-sections along the proximo-distal axis (UA: upper arm, LA: lower arm). Hoechst (blue), Col1A2:ER-Cre-ER;Caggs:lp-Cherry (red) overlaid with DIC. Scale bar: 200 μm. (F) Fraction of converted cells in five CT subtypes at different proximo-distal positions after regeneration, (cell number n > 8000, 3 independent limb samples). iF: Interstitial fibroblasts (fCT I-III). (G) Col1a2:ER-Cre-ER;Caggs:lp-Cherry labeled humerus transplantation into unlabeled host. Top: Stereoscopic images of live animals at 0 dpa and 15 dpa. Scale bar: 1 mm. Center: Longitudinal sections of 15 dpa blastema. Converted cells (red), HoxA11 (green), Hoechst (blue). Scale bar: 500 μm. Bottom: Magnified view showing co-localization of mCherry+ cells with HoxA11 antibodies. (H) Prrx1:Cre-ER;Caggs:lp-Cherry labeled humerus transplantation into unlabeled host. Left: Stereoscopic images of live animals at 0 dpa and 25 dpa. Scale bar: 1 mm. From left to right: Cross sections of limbs from UA-callus, UA-regenerate and LA-regenerate. Converted cells (red), Hoechst (blue). Scale bar: 200 μm. (I) Quantification of converted cells in periskeletal, skeletal and aggregate of periskeletal and skeletal subtypes (All) plotted on proximo-distal axis. (J) Unlabeled humerus transplantation into Prrx1:Cre-ER;Caggs:lp-Cherry converted host. Left: Stereoscopic images of live animals at 0 dpa and 25 dpa. Scale bar: 1 mm. From left to right: Cross sections of limbs from UA-callus, UA-regenerate and LA-regenerate. Converted cells (red), Non-converted cells (green), Hoechst (blue). Scale bar: 200 μm. Right: Magnified view showing mCherry+ periskeletal (Ps) and skeletal (Sk) and iF: Interstitial fibroblasts (fCT I-III). (K) Quantification of converted cells in periskeletal, skeletal and aggregate of periskeletal and skeletal subtypes plotted (All) on proximo-distal axis. (L) Pseudotemporal trajectory obtained by Diffusion Map projection (26) on genes identified by PCA (Table S10) for 18 dpa blastema cells of labeled Prrx1:Cre-ER;Caggs:lp-Cherry descendants links limb bud-like blastema progenitors to 2 emerging cell lineages: non-skeletal (precursors to all non-skeletal CT subtypes) and skeletal. (23) Scores for developmental, non-skeletal and skeletal signatures are projected onto the Diffusion Map.

