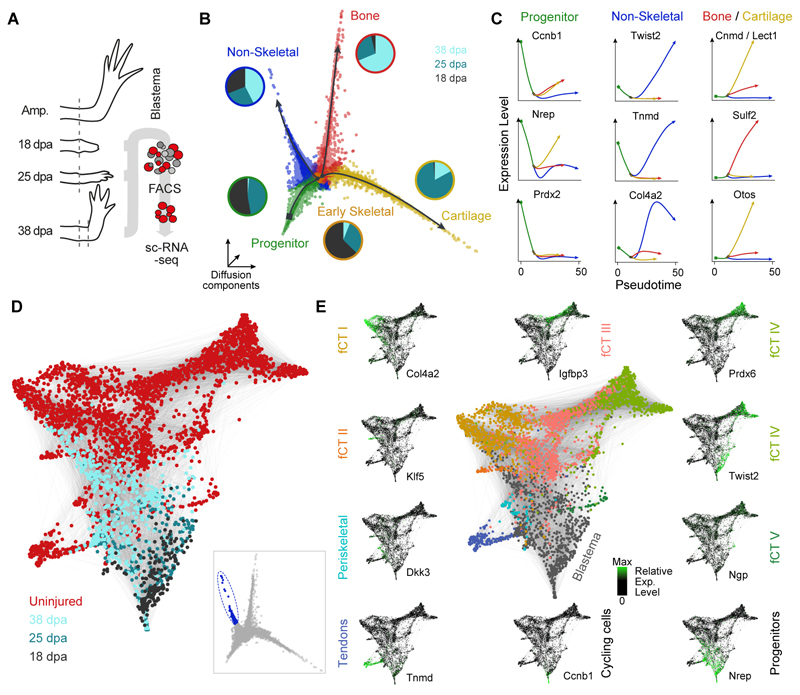
Fig. 5. Following the re-emergence of connective tissue lineages through multipotent progenitors.
(A) Schematic of high-throughput scRNA-seq experiments on late blastema stages using Prrx1:Cre-ER;Caggs:Lp-Cherry converted animals. ScRNA-seq was performed on FACS sorted mCherry+ CT cells of the uninjured axolotl upper arm (0 days post amputation, dpa) and during regeneration of the upper arm blastema at 18 dpa, 25 dpa and 35 dpa using the 10x Genomics Chromium controller. (B) Three-dimensional representation of a Diffusion analysis (16) of blastema time points (18, 25, 38 dpa) identifies 4 branches. Merlot (23) was used to identify end points and branching points (color coded) within the trajectory and to obtain branch-specific gene expression patterns. Pie charts next to the branches show the time point distribution per respective branch. (C) Pseudotemporal expression of marker genes along the branches identified in panel B. Shown markers were used to assign cell types to each branch (blastema progenitors, two skeletal lineages (cartilage and bone) and one non-skeletal lineage). (D) SPRING (27) visualization of late non-skeletal blastema cells (cells with highest pseudotime encircled and highlighted in blue in inset) together with mature CT cells (total 3151 cells) reveals emergence of CT subpopulations identified in the mature tissue. (E) Genes identified as markers for distinct CT subtypes (Tnmd, Col4a2, Twist2) in the mature uninjured tissue highlight the emergence of cell types during the last phases of regeneration while the expression of developmental blastema markers (Nrep) and cell cycle markers (Ccnb1) decrease during final differentiation.

