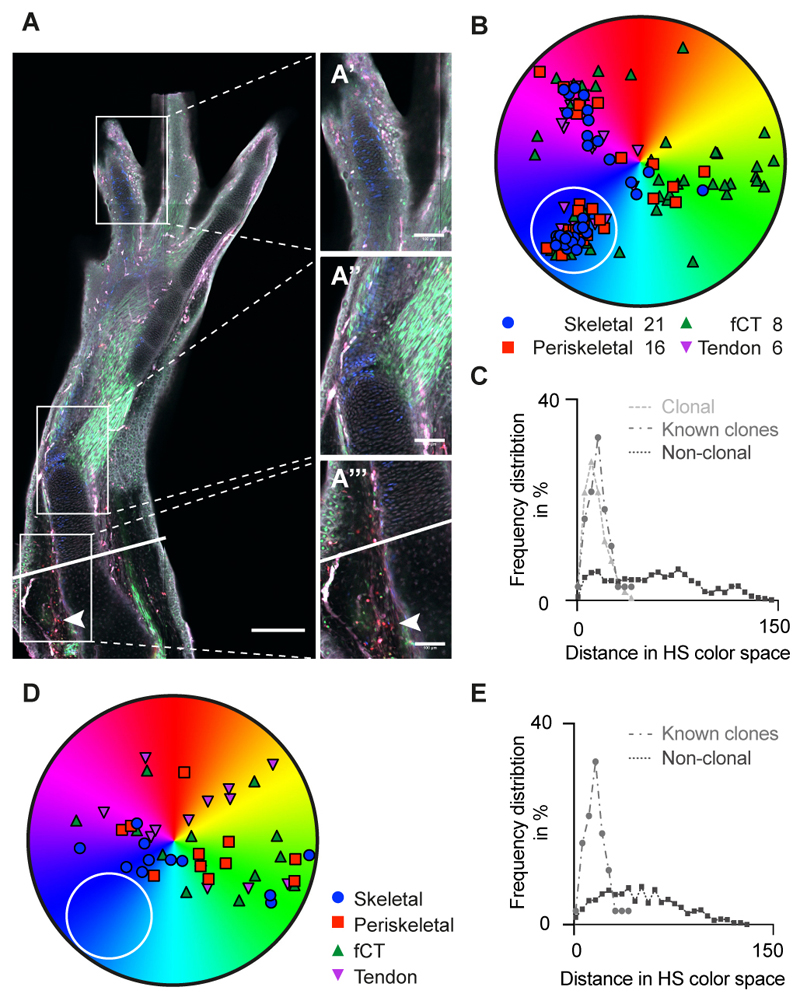
Fig. 6. Brainbow clonal analysis confirms multi-lineage potential of connective tissue cells upon limb regeneration.
(A) Representative image of a regenerated limb in a Brainbow axolotl. A presumptive clone of blue cells is observed throughout the limb, from the digit tip (A’), the elbow (A”), and amputation plane (solid line) at the injection site (arrowhead) (A”’). Scale bars: (A) 300 μm; (A’-A”’): 100 μm. (B) Example of HS color distribution of cells from a representative image containing a presumptive clone of blue cells (white circle). Multiple cells of each connective tissue sub-type (Skeletal cells, periskeletal cells, tenocytes and fibroblastic CT cells) are all represented. Similar distributions were observed in 3/10 analyzed samples (for examples see fig. S11H). (C) Frequency distribution in HS color space calculated using the formula (fig. S11E), for known clonally related cells (fig. S11, F and G), presumptive clonally related cells (“blue cells” in white circle, panel B) in a regenerated limb, and non-clonally related cells in a regenerate. Frequency distribution of suspected clonally related cells is indistinguishable from known clones (Kruskal-Wallis analysis and Dunn’s multiple comparison). (D) Example of HS color distribution of cells from a representative image lacking a discreet cluster of blue cells (white circle). Similar distribution was observed for 7/10 analyzed samples (for examples see fig. S11I). (E) Frequency distribution as in C for sample shown in D. Note that due to the lack in identifying a clonally related subset, no presumptive clone could be mapped.

