
FIGURE 1.
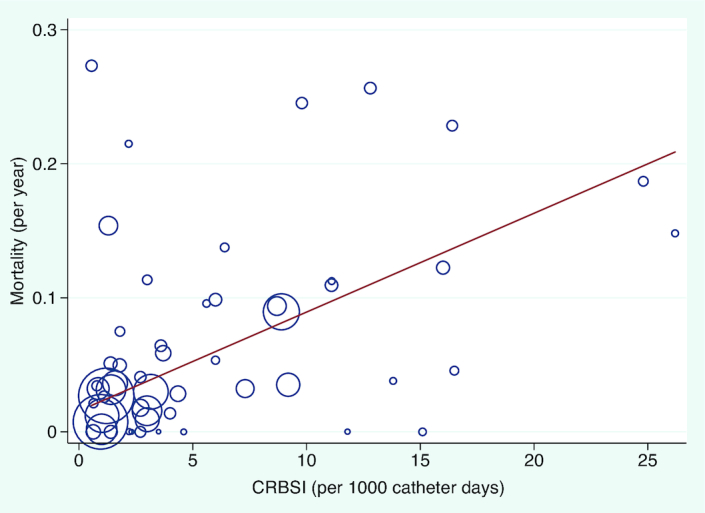
Meta-regression between rate of CRBSI per 1000 days and mortality per year. Each study (n = 53) is represented by a circle and size demonstrates weighting of each study, where larger circles indicate more patient-years of follow-up. The line of best fit shows the change in mortality rate for each incidence of CRBSI per 1000 days (β: 0.007; 95% CI: 0.003, 0.01), P value = 0.003. CRBSI, catheter-related bloodstream infection.