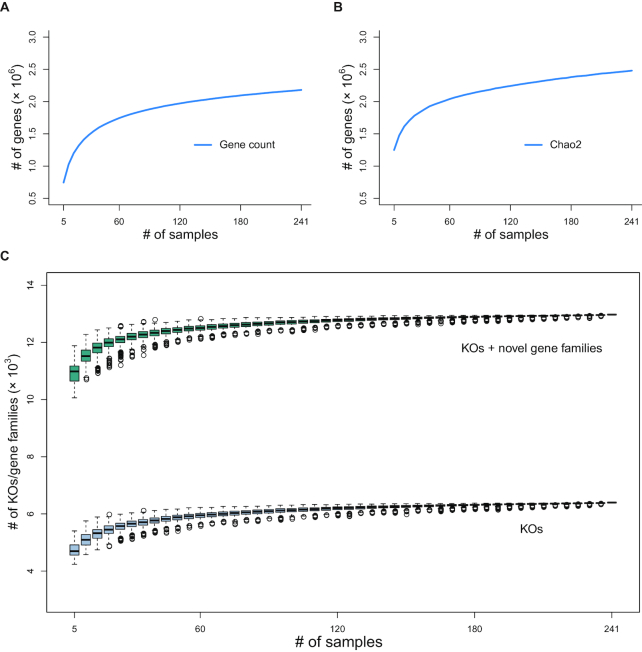
Figure 2:
Rarefaction curves for genes and KEGG orthologous groups/gene families. (a) Rarefaction curve for gene count. (b) Rarefaction curve for Chao2. The Respiratory Microbial Gene Catalogue (RMGC) captured 90.52% of the prevalent genes. (c) Rarefaction curve for KEGG orthologous groups/gene families. Known functions saturate quickly to 6,346 groups. After including novel gene families, the rarefaction curve plateaus when 12,924 groups are detected. Boxes represent the interquartile ranges (IQRs) between the first and third quartiles, and the line inside the box represents the median value. Whiskers represent the lowest or highest values within values 1.5 times the IQR from the first or third quartiles. Circles represent outliers.

