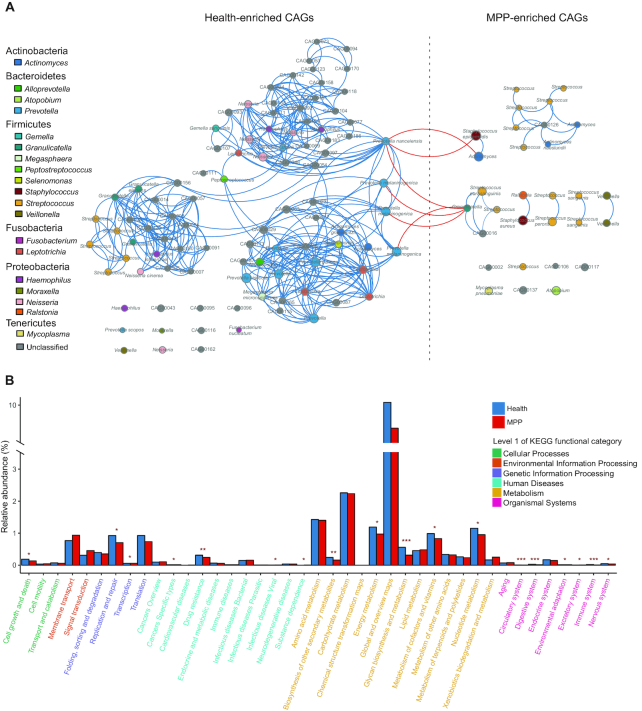
Figure 5:
Phylogenetic and functional alterations in children with pneumonia. (a) Size of the circle represents the mean relative abundance of co-abundance gene groups (CAGs) in healthy children or children with Mycoplasma pneumoniae pneumonia (MPP). A line between 2 circles indicates a Spearman's rank correlation coefficient ≥0.6 and an adjusted P-value ≤0.05. The phylum and genus corresponding to each CAG are indicated in the key. (b) X-axis represents level 2 functional categories in the KEGG; colours of the characters represent level 1 functional categories (listed on the right); Y-axis shows the relative abundance of level 2 functional categories. Adjusted P-values at *, ≤0.05; **, ≤0.01; and ***, ≤0.001, respectively.

