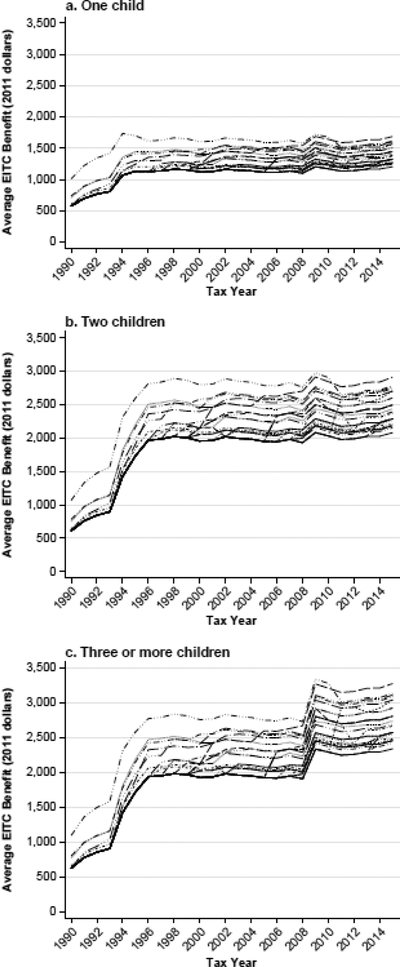
Fig. 1.
Variation in simulated instrument, by state and number of children. Data are for single women aged 19–45 with at least one child under the age of 19 residing in the household. Average household state and federal EITC benefits are from 1990–2015 in 2011 dollars. Each line represents a separate state. Federal variation is shown with the bottom line in each graph. See the description of simulated EITC in the text for more details. Source: 1996 Survey of Income and Program Participation and the National Bureau of Economic Research’s TAXSIM.

