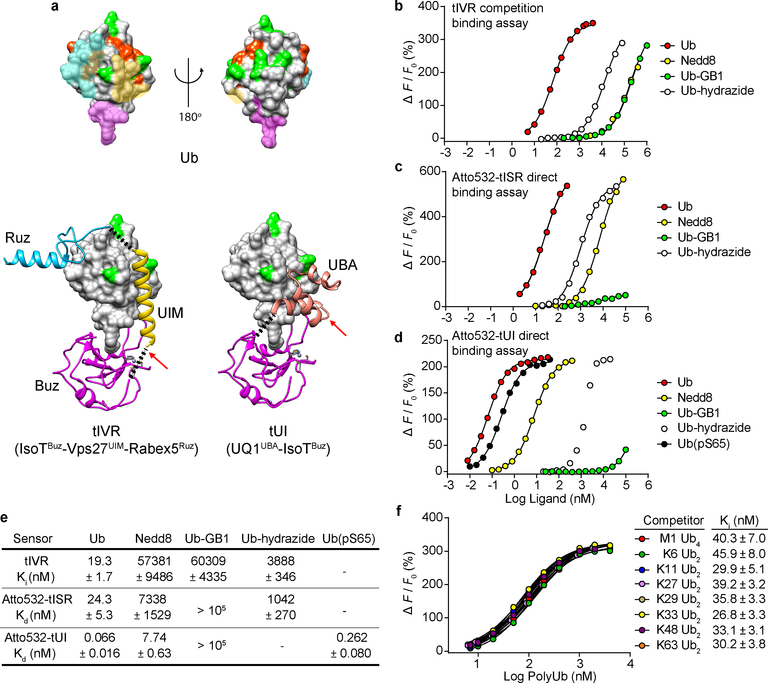
Fig. 1. Sensor design and characterization.
a, Ub (upper panel) has distinct surfaces recognized by three classes of UBDs. Ub and UBDs are shown in surface and ribbon representations, respectively. For Ub (upper models; from PDB 2G45), surfaces where Buz, UIM or UBA, and Ruz domains bind are in magenta, yellow, and cyan, respectively (PDB 2G45, 2FIF, 1Q0W, and 2JY6). Lysine and M1 sidechains (green) and phosphorylation sites (orange) are highlighted. Ub complexes with tIVR (lower left) and tUI (lower right) were modeled from composites of individual UBD-Ub complex structures. The black dotted lines indicate linkers installed to connect UBDs, and red arrows show sites of fluorophore attachment. b, tIVR affinities for Ub and UbL derivatives were measured by competition with 1 nM Atto532-Ub(S20C) in the presence of 6 nM tIVR. ΔF is the fluorescence intensity change of Atto532-Ub(S20C) upon addition of competitor and F0 is the fluorescence without competitor. Fluorescence intensity changes of (c) Atto532-tISR or (d) Atto532-tUI were measured by direct titrations with the Ub or UbL derivatives indicated and fit with a 1:1 binding model as described in Methods. The points shown are averages from duplicate samples. e, Affinities (Kd or Ki) of the three sensors determined for the indicated Ub and UbL ligands. f, Effects of Ub–Ub linkage type were assessed from competition binding assays with 0.8 nM Atto532-Ub(S20C) and 6.0 nM tIVR titrated with 7 to 4000 nM of the indicated polyUb ligands. Errors listed are standard deviations from the fits. Because in d the binding curve with Ub-hydrazide might reflect trace contamination by free Ub, a Kd value is not shown.

