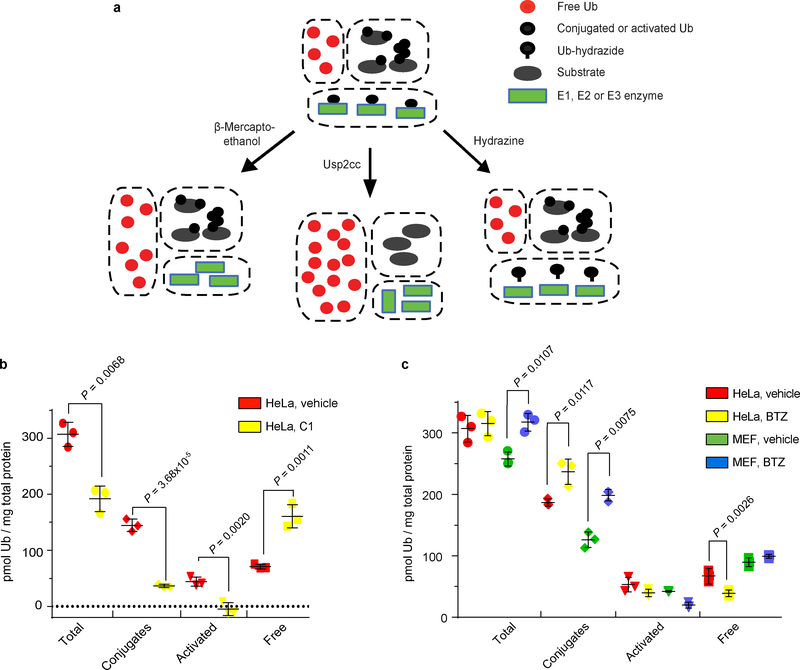
Fig. 3. Effects of cellular stresses on Ub pools.
a, Scheme used for the in-solution Ub pool measurements. b,c, Quantitation of Ub pools in lysates of indicated cell lines after treatment with vehicle (DMSO) or (b) E1 inhibitor, C1, at 10 μM or (c) proteasome inhibitor, BTZ, at 1 μM for 1 h. Statistical analyses by t-test (b) and ONE-WAY ANOVA with Bonferroni’s adjustment (c); error bars represent ± s.d. (n = 3).

