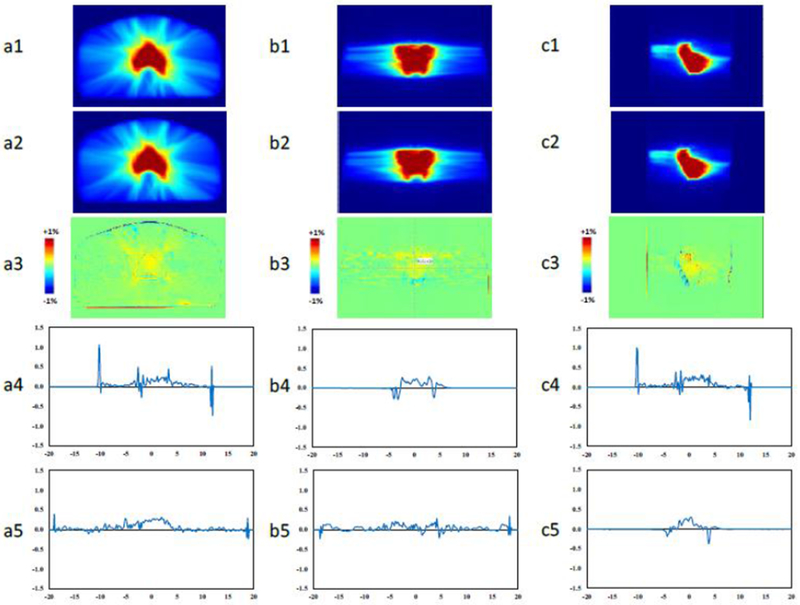
Figure 3.

Dose color washes of (1) pCT and (2) SCT plans for the patient shown in Figure 2. Dose difference maps between (1) and (2) are shown in (3). Dose percentage difference profiles on the 2 axes in each plane are depicted in (4) and (5). a, b, and c are axial, sagittal, and coronal views, respectively.
