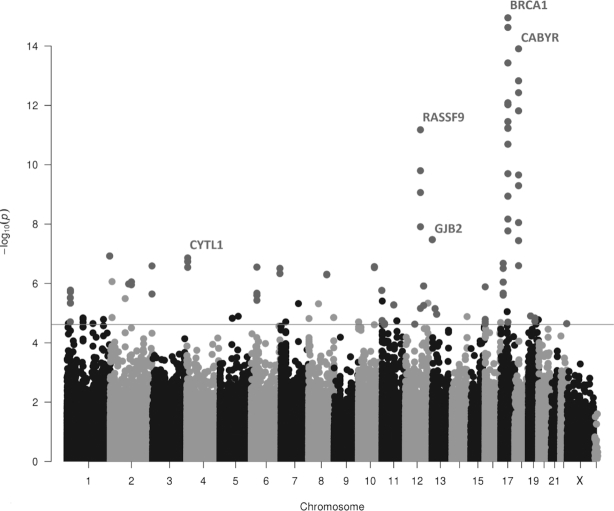
FIGURE 5.
Manhattan plot of the vitamin B-12-intake categorical model 3, showing the association between vitamin B-12 intake and genome-wide DNA methylation, with 29 significant DMRs adjusted for multiple comparisons using Sidak < 0.05 in 3565 samples. The red line represents the threshold of FDR < 0.05 of the correlation-adjusted P values of the CpGs. Green circles denote the CpGs that are present within the DMRs, whereas black/gray circles denote the single CpGs that do not represent DMRs. The nearest genes for the top 5 DMRs are reported. DMR, differentially methylated region; FDR, false discovery rate.

