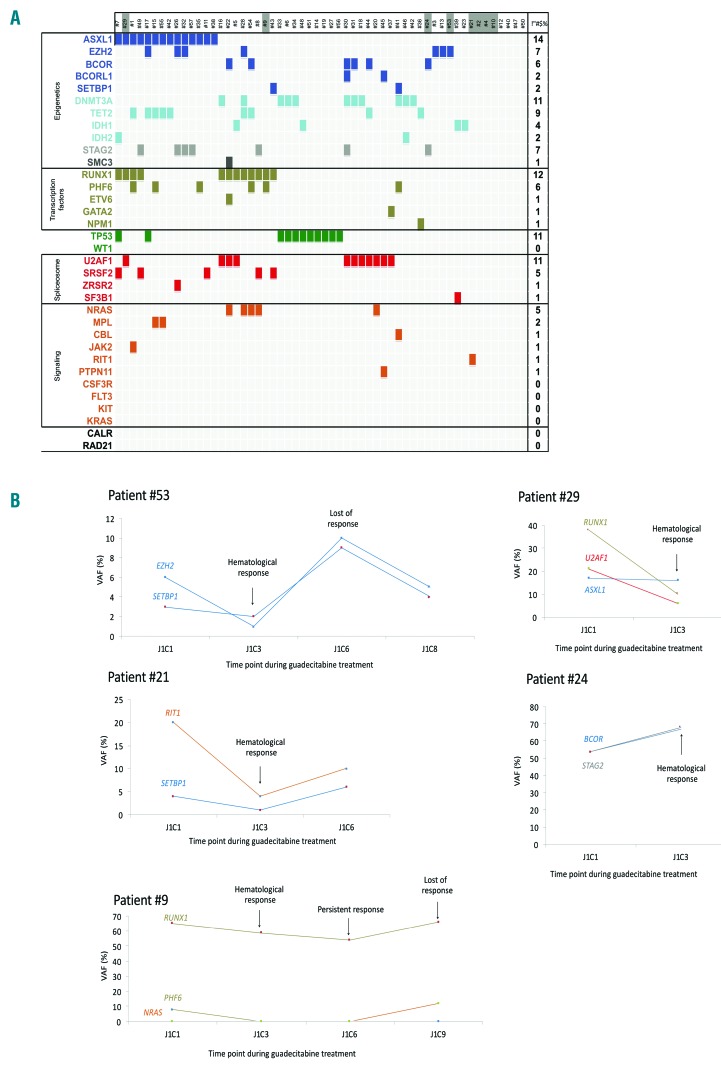
Figure 2.
Molecular characteristics of the patients after azacitidine (AZA) failure and during guadecitabine treatment. (A) Spectrum of mutations in the 56 high-risk myelodypslastic syndrome (MDS) patients included (refractory to or relapsing after AZA therapy) in 36 selected genes. Each column represents an individual patient sample, and each colored cell represents a mutation of the gene or gene group listed to the left of that row. The number of mutations in each row is indicated in the column on the right. Darker cells of patient numbers indicate responders to guadecitabine. (B) Evolution of different clones, according to variant allele frequency (VAF), in five patients responding to guadecitabine after AZA failure.

