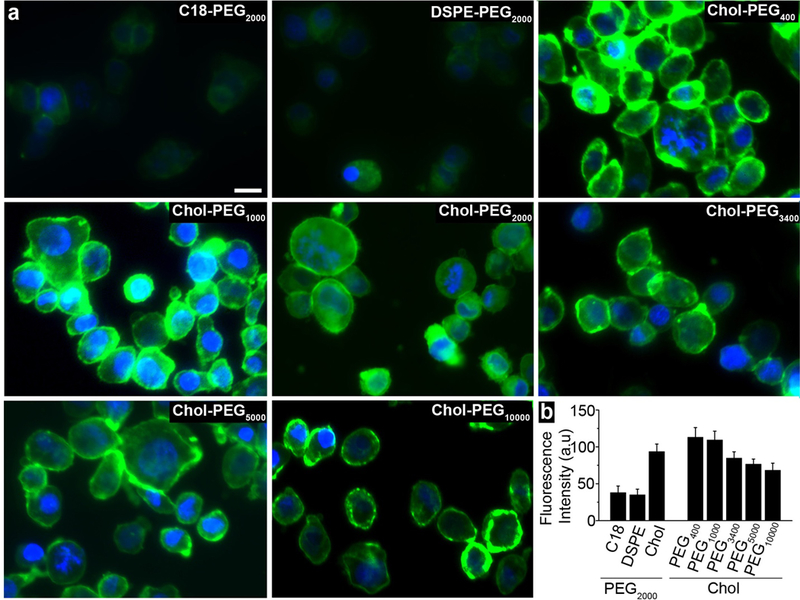
Figure 3.

Optimization of lipid nanoprobes for nEV isolation. a) various fluorophore labelled lipid nanoprobes inserted into cell membrane. Scale bar is 10 μm. b) quantitative data of average fluorescent intensity in each group. Error bars correspond to standard deviation (n=3).
