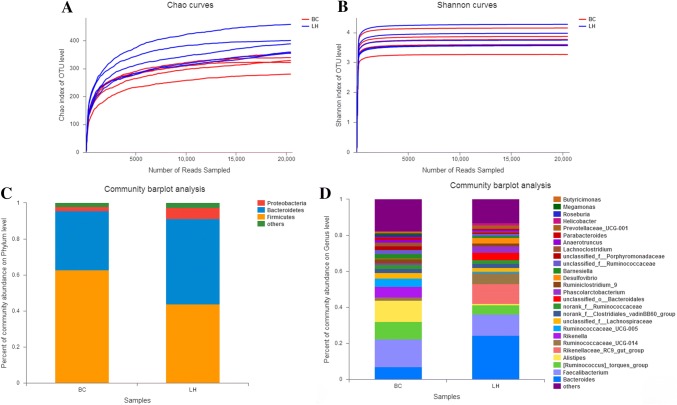
Fig. 1.
16S rRNA profiling of LH and BC samples. Panel a shows the average rarefaction curve representing the variation in the Chao diversity index at increasing sequencing depths for the LH and BC samples. Panel b shows the average rarefaction curve representing the variation in the Shannon diversity index at increasing sequencing depths for the LH and BC samples. Panel c shows the average taxonomic compositions at the phylum level for the LH and BC samples with a bar plot. The legend d shows the average relative abundance of each genus in all samples

