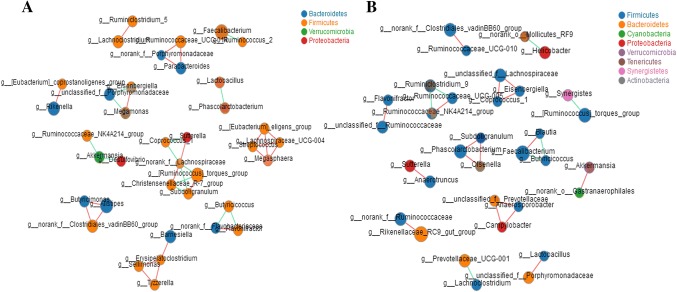
Fig. 3.
Network analysis of the cecal microbiota in BC and LH at the genus level. Size of the node indicates the abundance and the color of the connecting edge indicates the interaction type: co-presence, white; mutual exclusion, yellow. Its thickness indicates the weight of the interaction. Panels a and b show the BC and LH species correlation networks (relative abundances of the 50 most-abundant species), respectively

