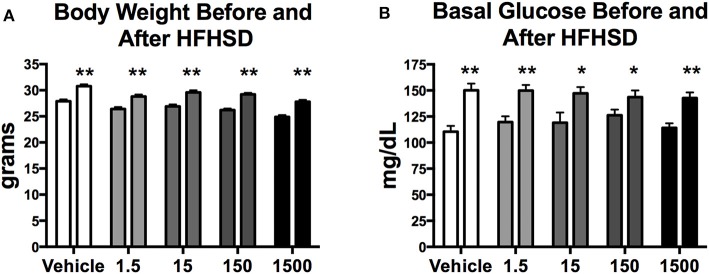
Figure 3.
Body weight and basal glucose levels before and after high fat high sugar diet (HFHSD) at 11 months of age. Estimated marginal means (±SEM) of body weight before and after 3 days on HFHSD (A), and basal blood glucose levels before and after 3 days on HFHSD (B). For body weight n = 10, 8, 9, 10, 9, respectively, for vehicle, 1.5, 15, 150, and 1,500 μg/kg/day treatment groups. For basal glucose levels before HFHSD n = 9, 9, 8, 9, 8, and after HFHSD n = 10, 11, 9, 10, 10, respectively for vehicle, 1.5, 15, 150, and 1,500 μg/kg/day treatment groups. Two way ANOVA comparing within group before and after HFHSD *p < 0.05, and **p < 0.0125.

