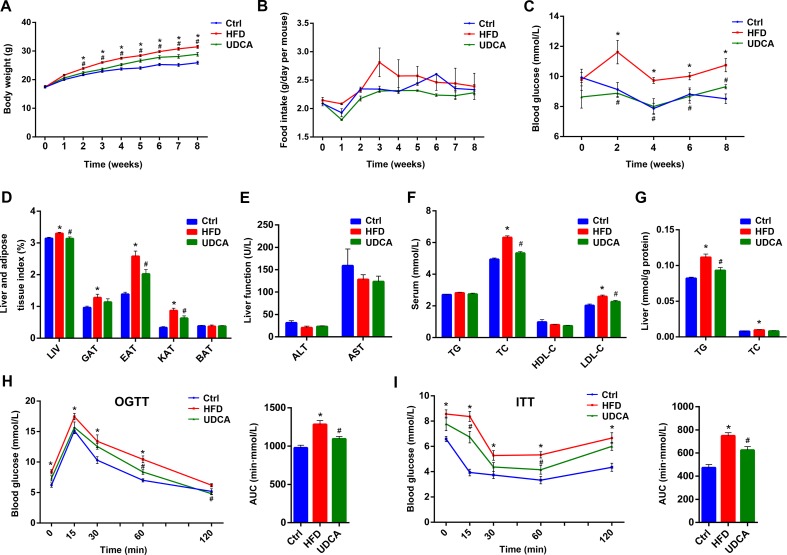
Figure 1.
Metabolic markers 8 weeks after high-fat diet (HFD) and ursodeoxycholic acid (UDCA) administration. (A) Changes in body weight over time. (B) Food intake over time. (C) Blood glucose over time. (D) Liver and adipose tissue index at week 8. (E) Liver function at week 8. (F) Serum TG, TC, high-density lipoprotein cholesterol (HDL-C), and LDL-C levels. (G) Liver levels of triglyceride (TG) and total cholesterol (TC). (H) Oral glucose tolerance test (OGTT) curve and area under the curve at week 7. (I) insulin tolerance test (ITT) curve and area under the curve at week 7. Ctrl, control group; HFD, 60% fat diet; UDCA, HFD with 0.5% UDCA. *P < 0.05 vs. control (ctrl) group; # P < 0.05 vs. HFD group.

