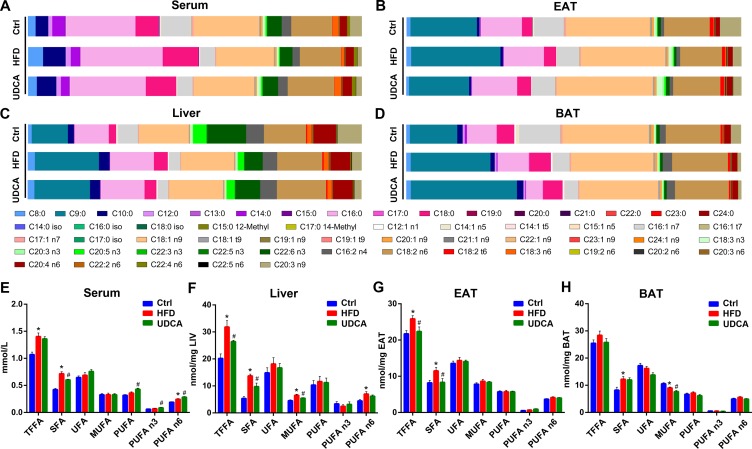
Figure 3.
Free fatty acid (FFA) composition and concentration of FFAs in different tissues. (A–D) FFA composition of serum (A), EAT (B), liver (C), and BAT (D). (E–H) Concentration of different FFA species in serum (E), liver (F), EAT (G), and BAT (H). Ctrl, control group; HFD, 60% fat diet; UDCA, HFD with 0.5% UDCA. *P < 0.05 vs. control (ctrl) group; # P < 0.05 vs. HFD group.

