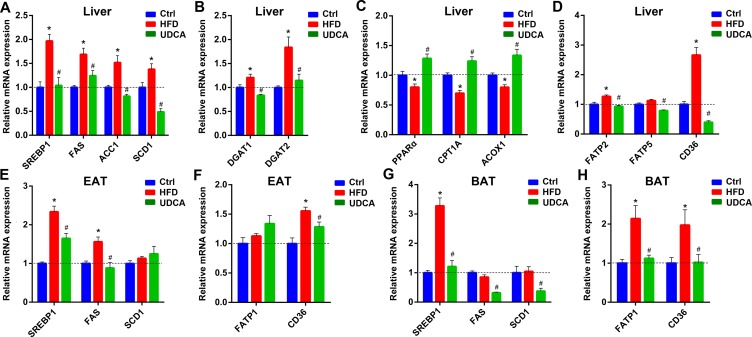
Figure 5.
Expression of genes involved in FFA synthesis, uptake, and oxidation; and in TG synthesis in liver, EAT, and BAT after HFD and UDCA administration. (A–D) Relative mRNA expression of genes involved in FFA synthesis (A), TG synthesis (B), FFA oxidation (C), and FFA transport (D) in liver. (E–H) Relative mRNA expression of genes involved in FFA synthesis in EAT (E) and BAT (G), and involved in FFA transport in EAT (F) and BAT (H). Ctrl, control group; HFD, 60% fat diet; UDCA, HFD with 0.5% UDCA. *P < 0.05 vs. control (ctrl) group; # P < 0.05 vs. HFD group.

