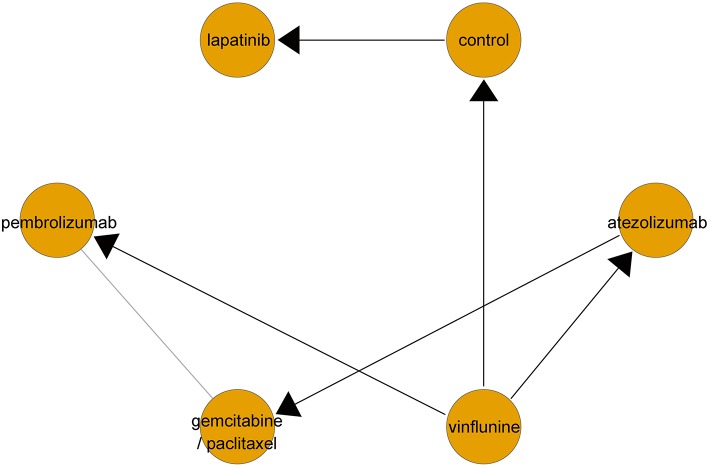
Figure 2.
Network geometry of clinical trials on second-line therapeutic agents for overall survival in metastatic urothelial carcinoma. Lines with arrows represent direct comparison between two treatments (set the side from which the arrow leaves as control arm). Gray line implies indirect comparison between two treatments.

