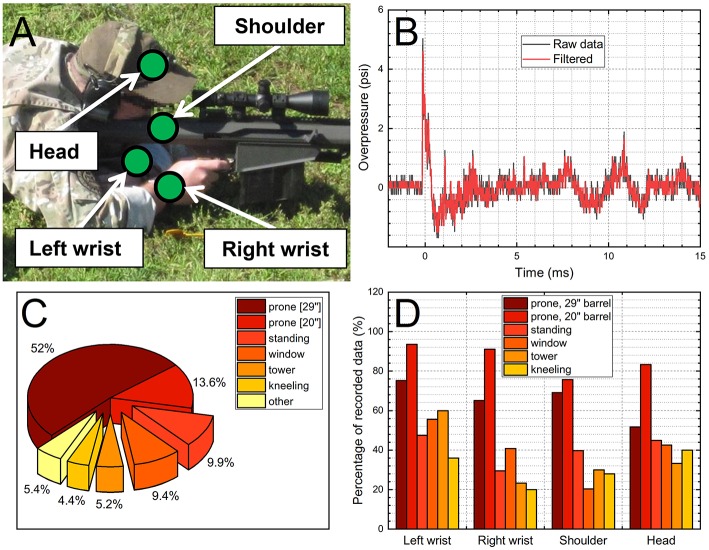
Figure 1.
The 0.50 caliber rifle training: (A) schematic of the sensor locations worn by the training participants, (B) example of the overpressure data collected by a B3 sensor (raw and filtered data are presented), (C) the pie chart illustrating fractional amount of the overpressure data collected during the 3 day course expressed as various shooting positions, (D) the percentage of the collected data as a function of the sensor location and shooting position.

