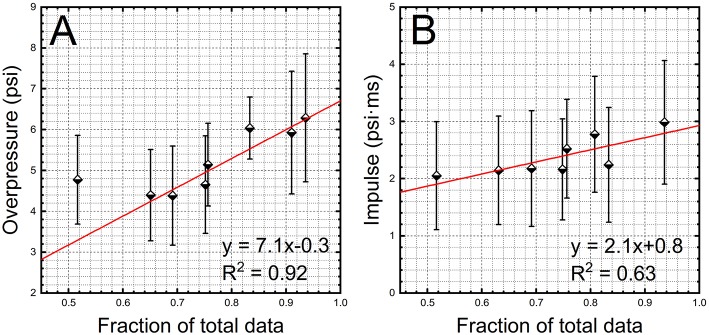
Figure 3.
The results of the linear regression analysis on peak overpressure (A) and impulse (B) values. The data collected for 20-inch and 29-inch barrels separated by a sensor location were pooled together. The average values of BOP and impulse as a function of the fraction of the recorded data were used to perform linear regression. The sensors used to monitor the occupational exposure are gradually losing their sensitivity (ability to trigger data recording) at lower BOPs.

