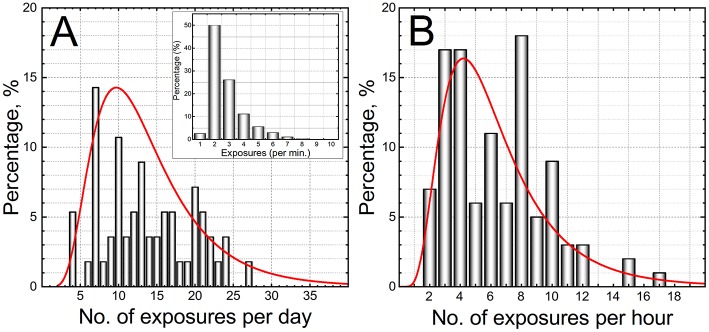
Figure 4.
The analysis of the number of exposures illustrates the dynamics of the training environment experienced by trainees. The frequency of the number of exposures: (A) per day, and (B) per hour are presented. All data of the 3 day training course were pooled together irrespectively on the rifle configuration or shooting position. The inset in panel A is a histogram which represents the frequency of the “burst” exposure during the training in the shooting range.

