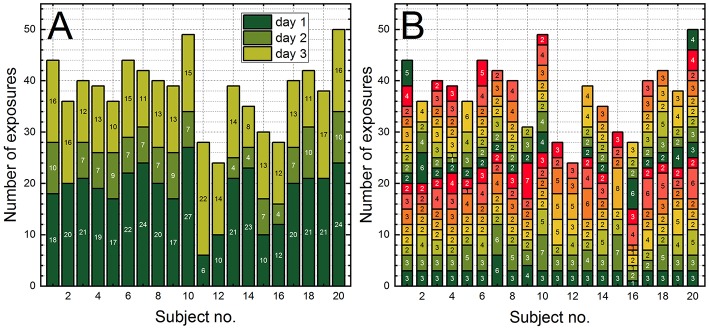
Figure 5.
The stacked column bar plots illustrating the cumulative number of exposures per trainee expressed as: (A) the sum of exposures per day, and (B) the sum of consecutive exposures recorded by the pressure sensors within 1 min (the “burst” exposure). The sum of “burst” exposures in (B) corresponds to the daily (counting from the bottom to the top) and the total sum of exposures in (A).

