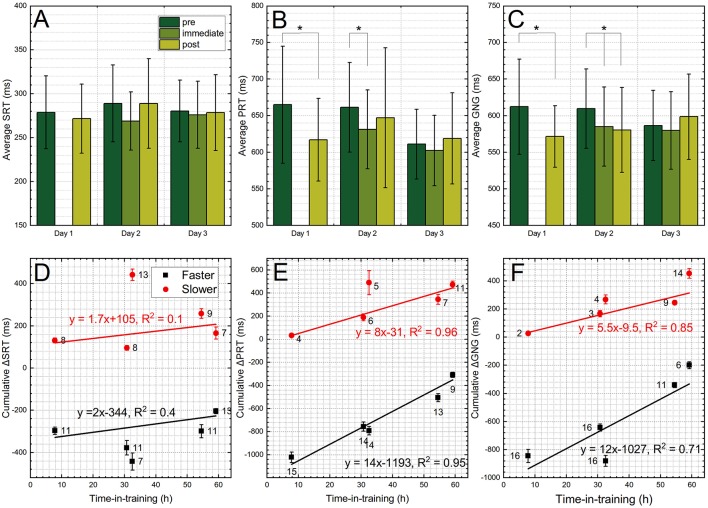
Figure 7.
The results of the DANA Rapid tests. The average cumulative values of the: (A) SRT, (B) PRT, and (C) GNG modules. These tests were performed before the training (pre), immediately after the training (immediate) and after the training (post). The data for each test were normalized by subtracting the values recorded before the training and separated as a “faster” and “slower” when these values were higher or below the zero, respectively. Then the data in respective groups were pooled together and plotted as a function of the training day for: (D) ΔSRT, (E) ΔPRT, and (F) ΔGNG test modules. The gradual shift toward the “slower” group, both in terms of number of trainees (numbers above or below of the data points) and the cumulative values (bar length) is observed with the time of training for PRT and GNG tests. Groups exceeding threshold of statistical significance (p < 0.005) are marked with asterisk.

